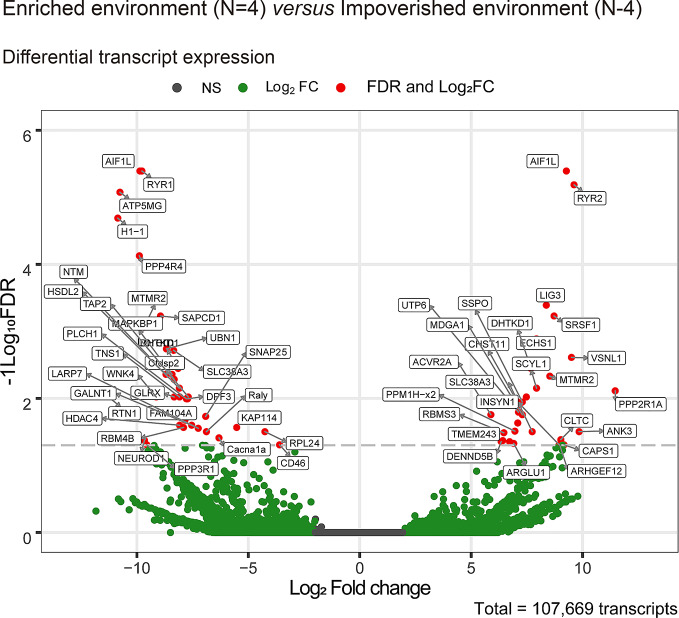
Figure 10.
Volcano plot of differentially expressed transcripts in IE and EE groups of Colossoma macropomum individuals. Middle compacted grey dots represent non-significant differential expression, green dots indicate transcripts that were differentially expressed for fold change, and red circles, above grey dotted line, correspond to differentially expressed transcripts (−1 < logFC > 1 and −1Log10FDR < 0.05). FDR indicates the false discovery rate (rate of false events; p values corrected for multiple comparisons).

