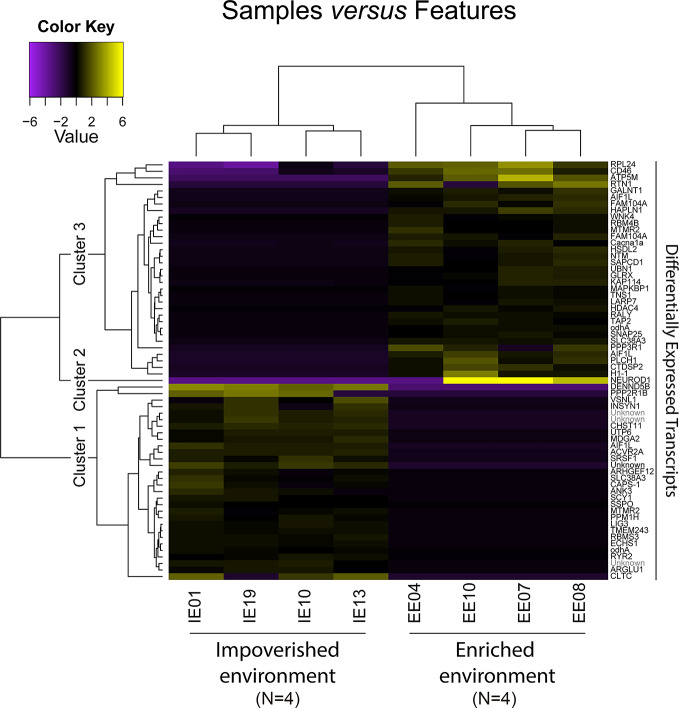
Figure 9.
Heatmap from 64 differentially expressed transcripts from C. macropomum individuals. Yellow indicates upregulated and purple downregulated transcripts. The upper cladogram represents a cluster analysis between individuals based on transcript expression, and the left cladogram shows the cluster analysis between each transcript. Three main clusters of transcripts with distinct expression profiles are indicated. On the right is the transcript annotation according to best BLAST hit (see Table S8.xlsx). “Differentially expressed transcripts”.

