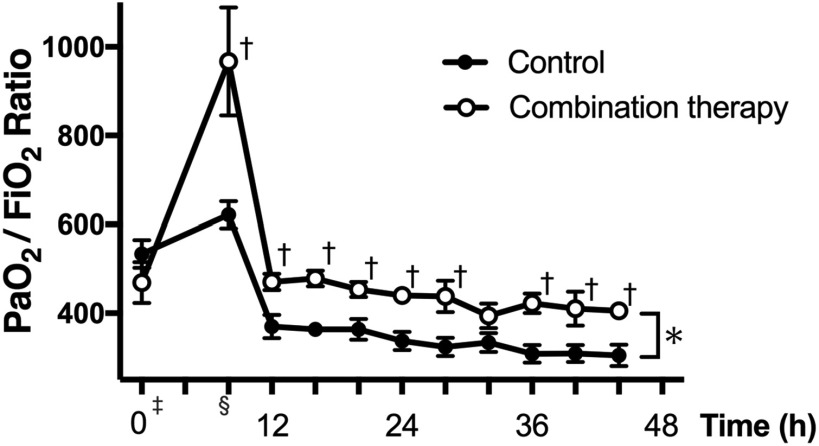
Fig. 1. Changes in PaO2/FiO2 ratios.
The PaO2/FiO2 ratios were recorded from the beginning of surgery to 48 hours postoperatively. ‡: PaO2/FiO2 ratios recorded after intubation. §: PaO2/FiO2 ratios recorded at the end of operation (almost 8 hours after the beginning). The error bars show the standard error of the mean. * p <0.05 indicates a statistically significant difference using a mixed-effects model for repeated measures. †p <0.05 compared with the control group as determined by post-hoc analysis and Student’s t-test.

