FIGURE 4.
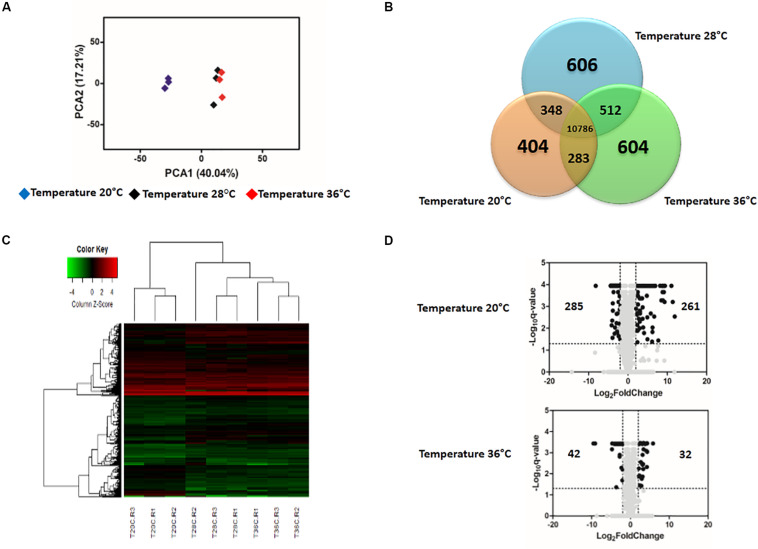
Effect of temperature on the expression profile of Zika-exposed Aedes aegypti. (A) Principal Component Analysis (PCA) plot showing the global gene expression profiles. (B) Venn Diagram reporting the number of specific and shared genes. (C) Heatmap plot showing local differences (naming scheme: TC20R1 = replicate 1 for the temperature 20°C). (D) Volcano plot representing the differential gene expression in RNAseq samples from infected Ae. aegypti exposed to three different constant temperatures (20, 28, and 36°C) at 48 h.

