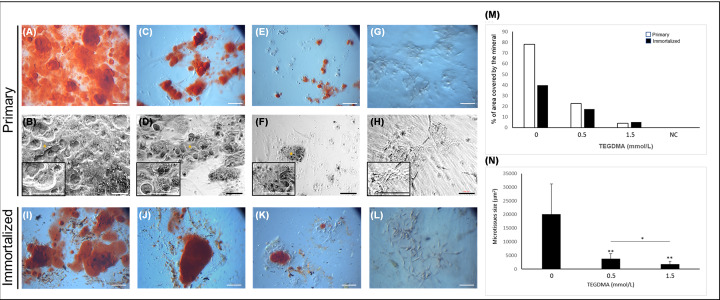
Figure 6. The impact of TEGDMA on the capability of human DPSCs microtissues to deposit the mineral in the matrix.
Stereomicroscopic (A,C,E,G,I–L) and phase-contrast (B,D,F,H) images of mineralization induced in non-treated cells (A,B,I) and cells treated with 0.5 mmol/l TEGDMA (C,D,J) and 1.5 mmol/l TEGDMA (E,F,K). Non-treated, non-mineralized microtissues serving as negative control, NC (G,H). Alizarin red S-stained calcium deposits are marked by asterisk. The percentage of area covered by deposited mineral (M) and the size of primary mineralizing microtissues (N) as a function of TEGDMA concentration (*P≤ 0.05, **P≤ 0.01). Bar scale = 100 μm.

