
FIGURE 1.
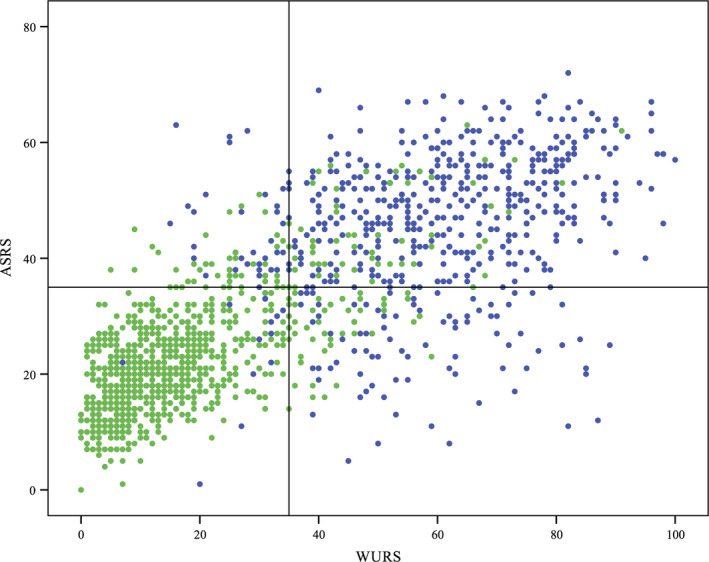
Distribution of WURS and ASRS scores in the ADHD and control samples. Top left: Distribution of ASRS scores. Bottom left: Distribution of WURS scores. Right: Overlap between scores on the WURS and ASRS. Controls are green. ADHD patients are blue. Lines represent a cutoff score of 35; vertical line for WURS, horizontal line for ASRS. This gives a sensitivity of 0.90 and specificity of 0.88 for the WURS, and a sensitivity of 0.80 and specificity of 0.88 for the ASRS