FIGURE 3.

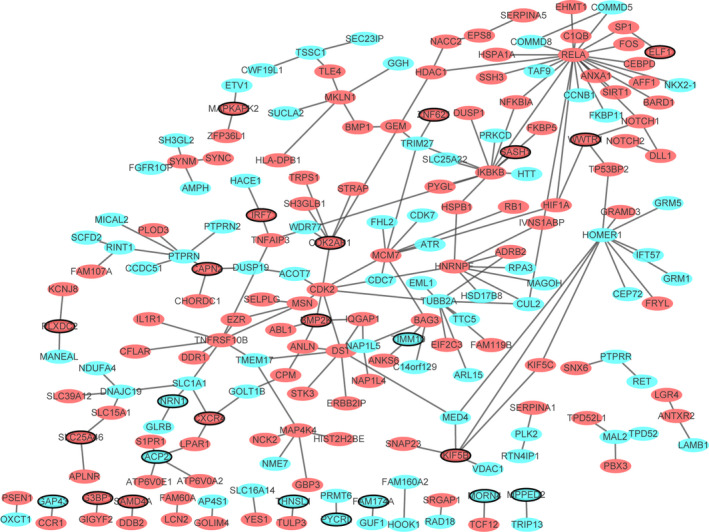
PPI network. Ellipses were used to represent nodes, and lines were used to represent edges. Green represents a downward adjustment, and red represents a downward adjustment. The black border indicates top 20 Up/Down

PPI network. Ellipses were used to represent nodes, and lines were used to represent edges. Green represents a downward adjustment, and red represents a downward adjustment. The black border indicates top 20 Up/Down