FIGURE 8.

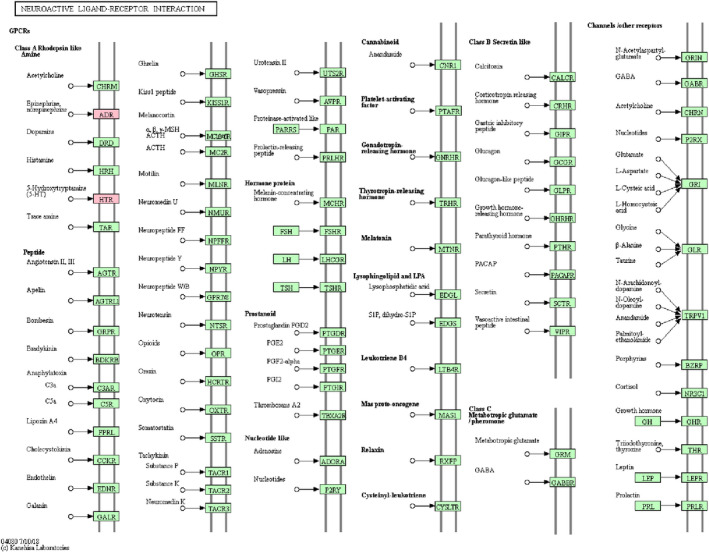
The neuroactive ligand–receptor interaction pathway. The red rectangles were represented the components regulated by the DEGs that enriched in AD

The neuroactive ligand–receptor interaction pathway. The red rectangles were represented the components regulated by the DEGs that enriched in AD