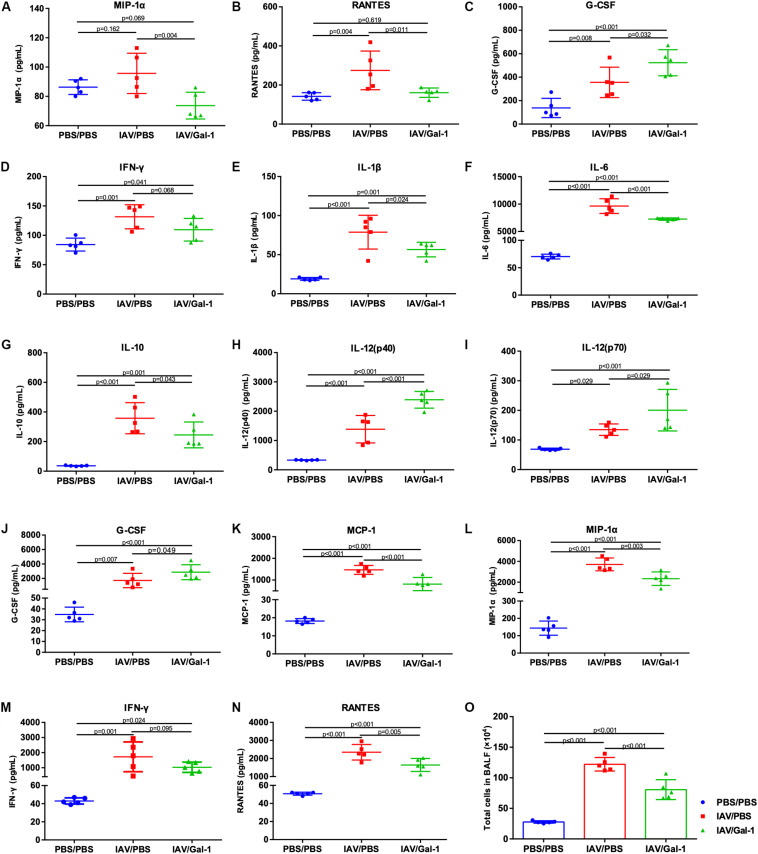
FIGURE 5.
Assessment of cytokines and chemokines and total cell numbers in serum or BALF of H1N1pdm09-infected mice in different groups. (A–D) Expression of cytokines and chemokines in mouse serum. (E–N) Expression of cytokines and chemokines in mouse BALF. (O) Lung inflammation was evaluated by total cell counts in BALF of mice from different groups (n = 5). Representative data shown from two independent experiments. P-values are indicated in the panels.

