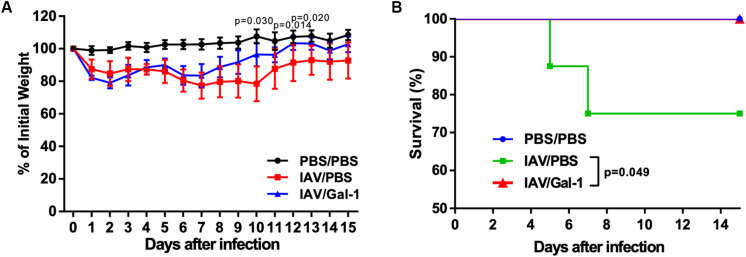
FIGURE 7.
Weight curve and survival curve of mice in different groups. (A) Mean changes of body weights from 0 d.p.i. through 15 d.p.i. Body weight was expressed as a percentage of 0 d.p.i. body weight. (B) Kaplan–Meier survival curves of different groups of mice (n = 13–16). Representative data shown from two independent experiments. P-values are indicated in the panels.

