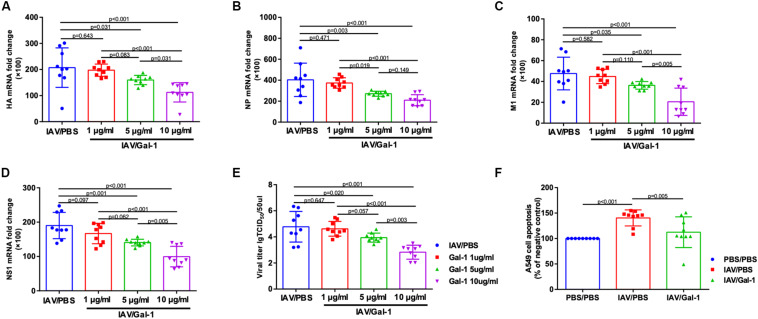
FIGURE 8.
The comparison of viral mRNA expression, viral titers and cell apoptosis in A549 cells between Gal-1 treated and untreated group. (A–D) A549 cells were incubated with H1N1pdm09 (1 × 10³ TCID50) for 2 h and recombinant human Gal-1 (1, 5, or 10 μg/mL) was added. At 72 h.p.i., the fold change in viral HA (A), NP (B), M1 (C), NS1 (D) mRNA levels in A549 cells treated with Gal-1 were examined compared with untreated controls. (E) Viral titers in Gal-1-treated A549 supernatant compared with untreated controls at 72 h.p.i. (n = 9). (F) The comparison of apoptotic A549 cell percentage in PBS/PBS, IAV/PBS and IAV/Gal-1 (10 μg/mL) groups by ELISA at 72 h.p.i. (n = 9). Representative data shown from three independent experiments. P-values are indicated in the panels.

