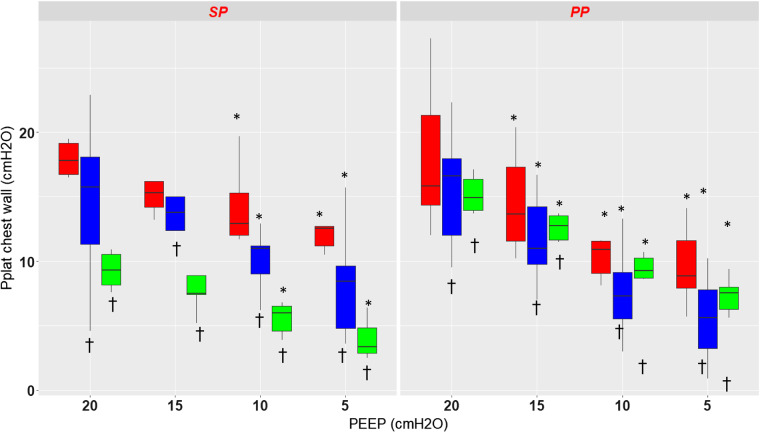
Fig. 3.
Box-and-whisker plots of end-inspiratory static pressure chest wall (Pplat) measured with the esophageal probe (red) and the dorsal (blue) and the ventral (green) pleural sensors in supine (SP) and prone (PP) positions at different levels of positive end-expiratory pressure (PEEP) from 20 to 5 by steps of 5 cmH2O. *P < 0.05 vs. PEEP 20 cmH2O, †P < 0.05 vs. esophageal pressure. Vertical lines indicate , where IQR is interquartile range.

