
. 2020 Jun 7;2020:2720905. doi: 10.1155/2020/2720905
Copyright © 2020 Lili Liu et al.
This is an open access article distributed under the Creative Commons Attribution License, which permits unrestricted use, distribution, and reproduction in any medium, provided the original work is properly cited.
Figure 1.
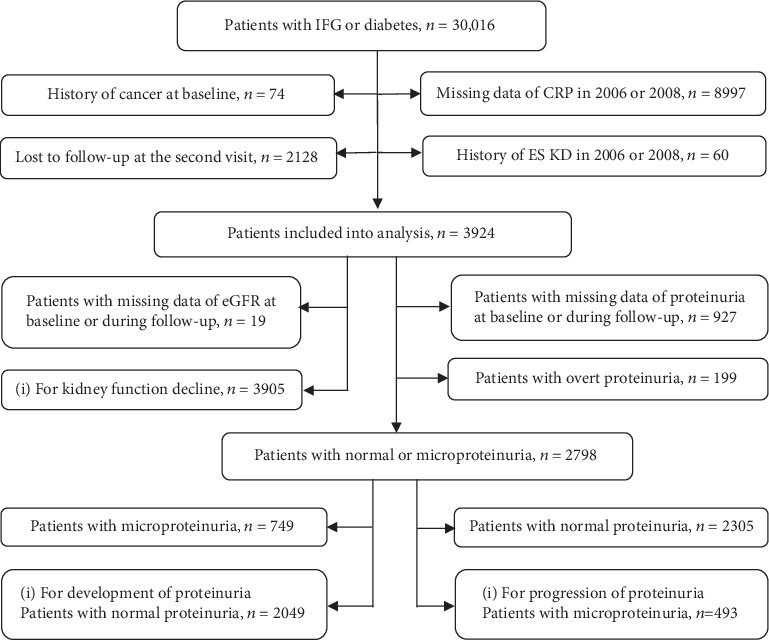
The detailed flow chart of study population.