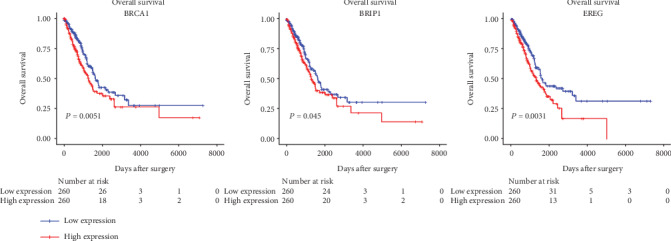
Figure 4.

Three candidate genes of significant prognostic value. Kaplan-Meier curves showing the relationship between the three mRNAs and overall survival. The cases were divided into the low- and high-expression groups by the median expression level of genes.
