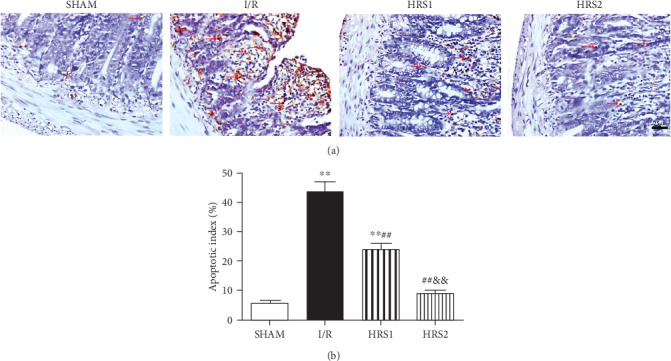
Figure 3.

HRS attenuated apoptosis in intestinal tissues. (a) Representative images for intestinal apoptotic cells (original magnification ×400). TUNEL-positive cells with dark brown nuclei indicated apoptosis (red arrows). (b) The quantitative analysis of apoptotic index among different groups. The data were represented as mean ± SD (n = 8/group). ∗∗P < 0.01 vs. SHAM group; ##P < 0.01 vs. I/R group; &&P < 0.01 vs. HRS1 group. Scale bar = 25 μm.
