
Figure 5.
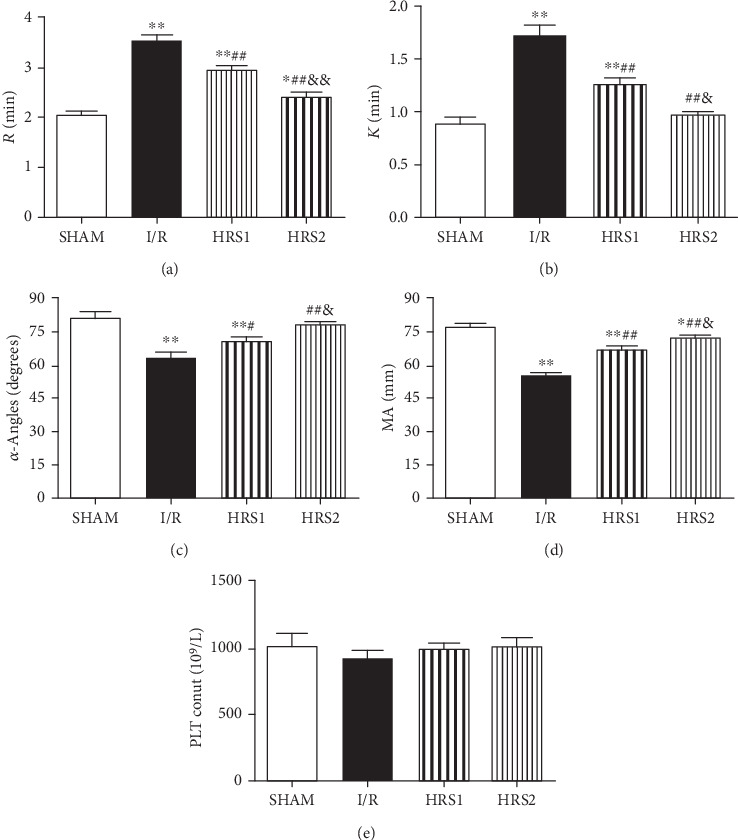
Effects of HRS on thromboelastography (TEG) and platelet count. (a–e) were R, K, α-Angles, MA, and PLT count, respectively. The data were represented as mean ± SD (n = 8/group). ∗P < 0.05, ∗∗P < 0.01 vs. SHAM group; #P < 0.05, ##P < 0.01 vs. I/R group; &P < 0.05, &&P < 0.01 vs. HRS1 group.