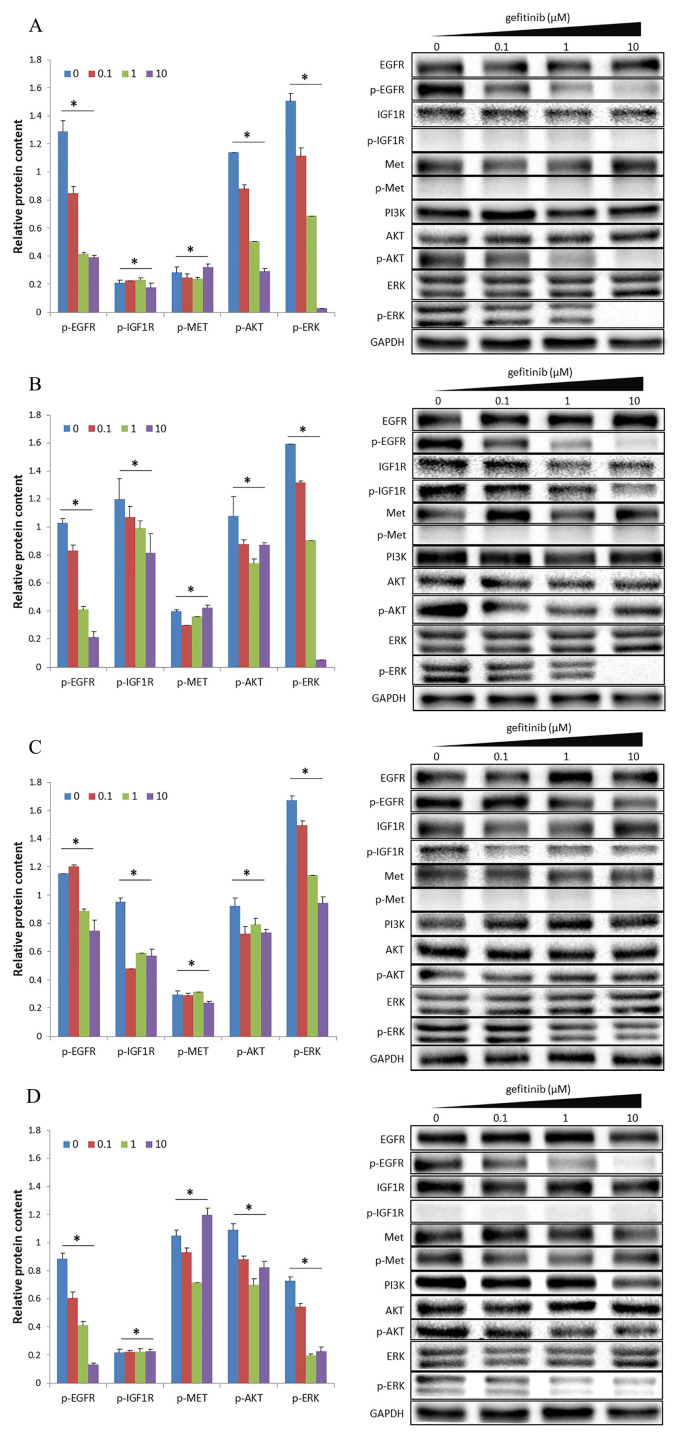
Figure 1.
Activation status of IGF1R and MET signaling pathways in terms of protein expression in four cell lines: (A) H1650, (B) H1650GR, (C) H1975, and (D) H460. The internal control was GAPDH. The bar chart presents results as the mean of three independent experiments. Blots are representative of three independent experiments.
*p-value < 0.05. One-way ANOVA was used to compare the four groups with concentrations of gefitinib from 0 to 10 μM.
GAPDH, glyceraldehyde 3-phosphate dehydrogenase; IGF1R, insulin-like growth factor receptor-1; MET, hepatocyte growth factor receptor.

