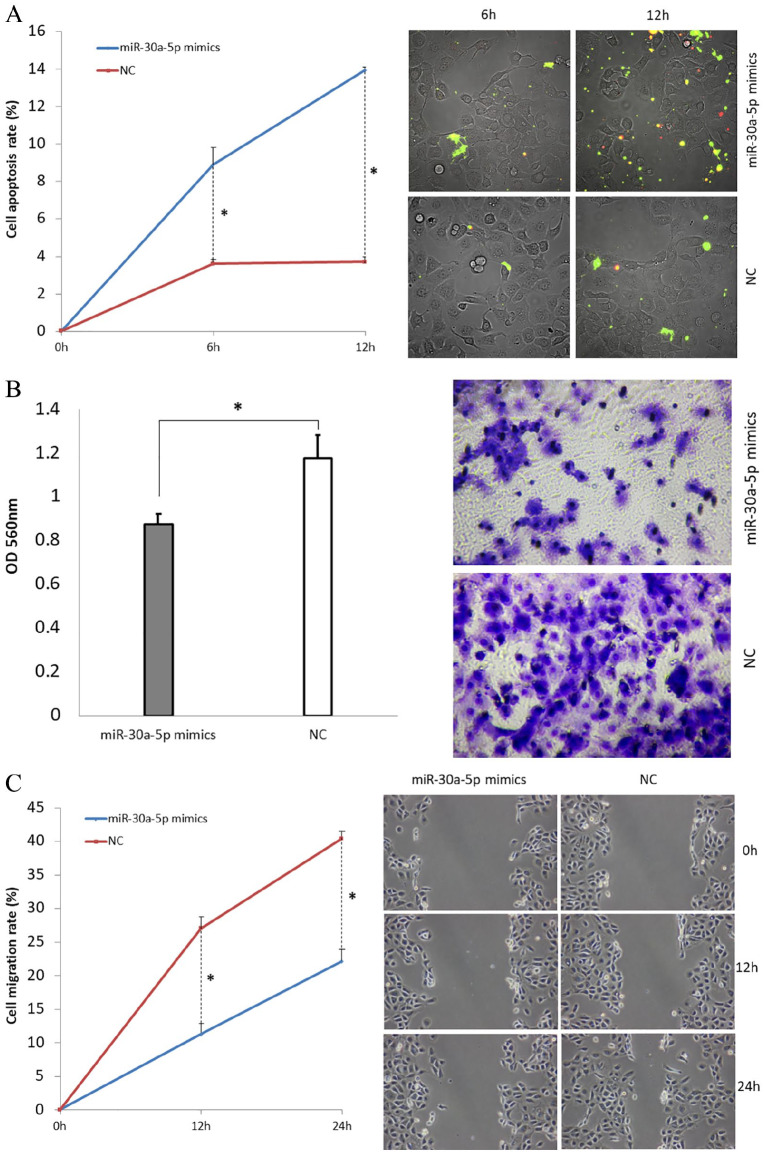
Figure 4.
H1650GR cell line assays following transfection with miR-30a-5p mimics. (A) Cell apoptosis assay. The chart shows the results as the mean of three independent experiments. Green represents the early stage of cell apoptosis, and red represents apoptotic cells at the late stage. (B) Cell invasion assay. Invasive cells at the bottom of the invasion membrane were stained and quantified by measuring OD at 560nm after extraction. The bar chart presents the results as the mean of three independent experiments. *p-value < 0.05. (C) Cell wound healing assay. At 0 h, 12 h, and 24 h after the wound was induced, microscopy images of cells migrating towards the scratch were taken. The chart presents the results as the mean of three independent experiments. Wound length was measured to calculate migration rate. Representative microscopy images are shown.
OD, optical density.

