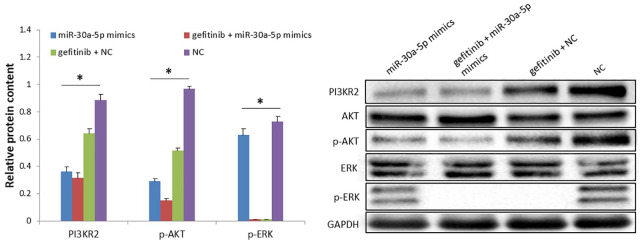
Figure 5.
Combination treatment effect of gefitinib and miR-30a-5p mimics on the expression levels of p-AKT and p-ERK in the H1650GR cell line. The bar chart presents results as the mean of three independent experiments. Blots shown are representative of three independent experiments.
*p-value < 0.05, one-way ANOVA.
ANOVA, analysis of variance.

