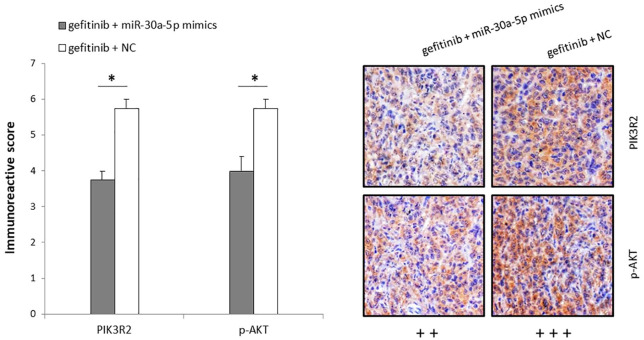
Figure 7.
Immunohistochemistry analysis of xenograft tumors after 3-week treatments with gefitinib+miR-30a-5p and gefitinib only, showing expression of PIK3R2 and p-AKT in the H1650GR gefitinib+miR-30a-5p and H1650GR gefitinib+NC groups. The bar chart presents the mean immunoreactive score of PIK3R2 and p-AKT in tumors among four mice.
*p-value < 0.05 in t-test. Representative immunohistochemistry images are shown on the right.

