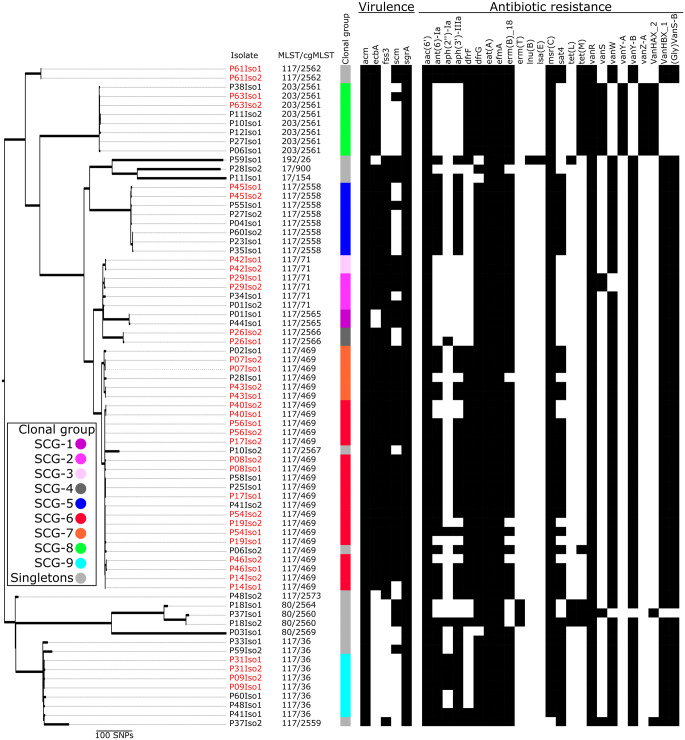
Figure 1.
Phylogenetic tree of VREfm causing bacteraemia, Heidelberg 2016. The phylogenetic tree was rooted at midpoint. Black squares indicate the presence of virulence and resistance genes, whereas white squares indicate their absence. Red isolate identifiers indicate that both blood culture and rectal isolates were identical (≤10 SNPs). SCGs were defined using an SNP threshold of ≤10 (minimum spanning tree; see Figures S2 and S3).

