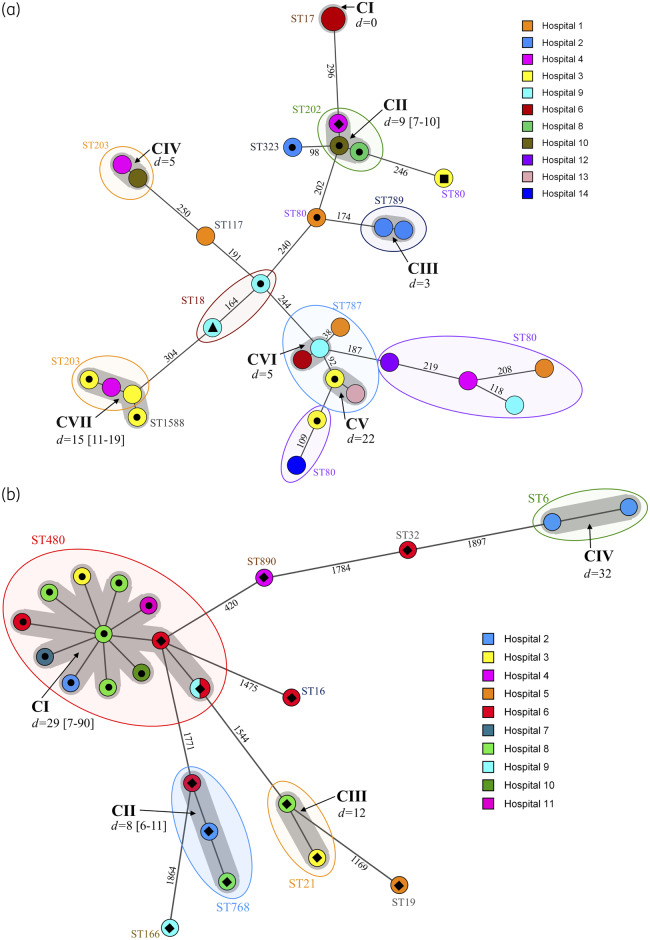
Figure 1.
Minimum spanning trees based on (a) cgMLST data from 30 linezolid-resistant clinical E. faecium isolates and (b) wgMLST data from 25 linezolid-resistant E. faecalis clinical isolates. All isolates were recovered between June 2016 and August 2019 from 14 Irish hospitals, as denoted in the legends. The numbers on the branches represent the number of cgMLST/wgMLST allelic differences. STs are shown in coloured ovals. Grey shadowing around nodes indicates clusters of related isolates, which are labelled in bold and denoted CI–VII; ‘d=’ values indicate average allelic differences and the range in square brackets. Isolate designations are as follows: filled black circle, poxtA positive; filled black diamond, optrA positive; filled black square, optrA positive and cfr(D) positive; and filled black triangle, optrA positive and poxtA positive. Isolates not marked with a symbol were negative for linezolid resistance genes and harboured various copy numbers (1–5) of the G2576T 23S mutation associated with linezolid resistance.

