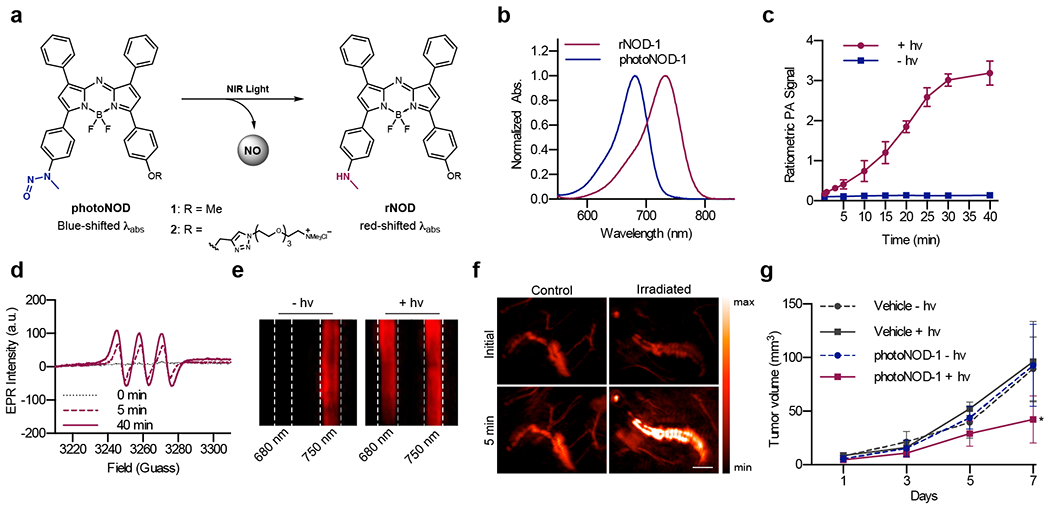
Figure 4.

a) Chemical structure of photoNODs and rNODs. b) Normalized absorbance spectra of photoNOD-1 and rNOD-1 in CHCl3. c) Time-dependent ratiometric PA signal of photoNOD-1 produced with or without irradiation. d) EPR spectra of photoNOD-1 collected after 0, 5 and 40 minutes of irradiation in the presence of Fe(MGD)2. e) PA images of photoNOD-2 with or without 5 min of irradiation. f) PA images of photoNOD-2 after subcutaneous injection and a 5 min period with/without irradiation. g) Tumor volumes following repeated systemic administration of photoNOD-1 or vehicle with/without irradiation.
