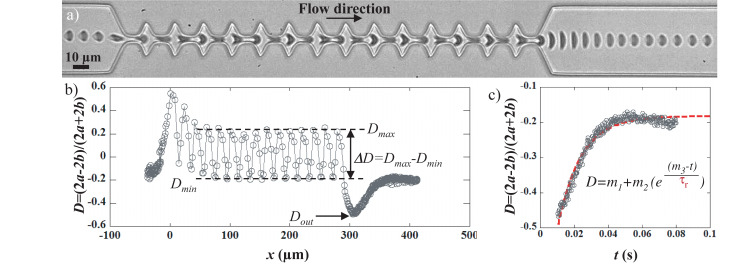
FIGURE 2.
(a) sequence of deformation of a healthy RBC flowing in the geometry at 200 mbar and (b) the associated variation of the deformation index D [D = (2a–2b)/(2a + 2b)] as a function of the position of the cell center of mass. The origin of the graph has been arbitrarily chosen at the entrance of the first narrowing. The amplitude of deformation ΔD is calculated as ΔD = Dmax–Dmin, where Dmax and Dmin are the mean of D in the constrictions and the enlargements, respectively. The minimum of the curve corresponds to the large cell elongation at the exit of the last constriction, noted Dout. (c) representation of D versus time of the previous graph, where only the time window of the cell recovery is reported. The exit of the last narrowing was set to be t = 0. The dashed red line is an exponential fit allowing the determination of the recovery time τr according to the following equation D = m1 + m2 exp((m3–t)/τr), where m1, m2, and m3 are constant to be adjusted.

