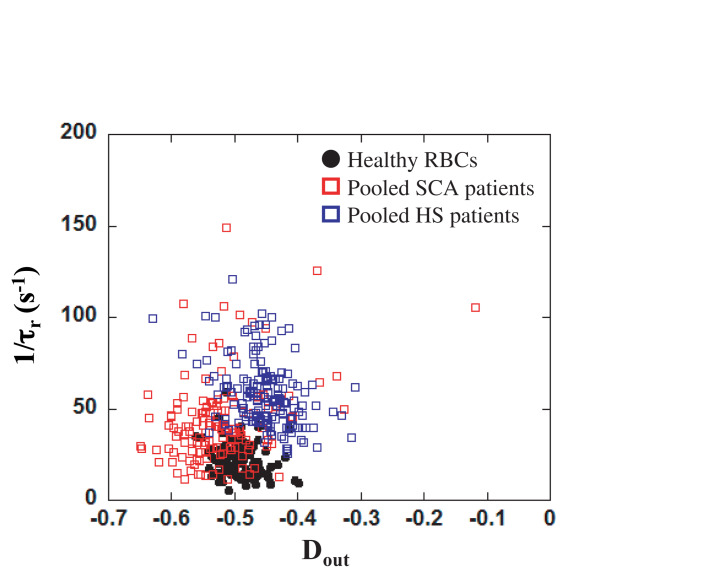
FIGURE 7.
Dout versus 1/τr for healthy RBCs (solid black circles), pooled SCA patients (open red squares) and pooled HS patients (open blue squares). A MANOVA statistical analysis revealed that the RBCs distribution was significantly different between the three groups (p < 0.05 between HS and healthy, p < 0.05 between SCA and healthy, and p < 0.05 between HS and SCA).

