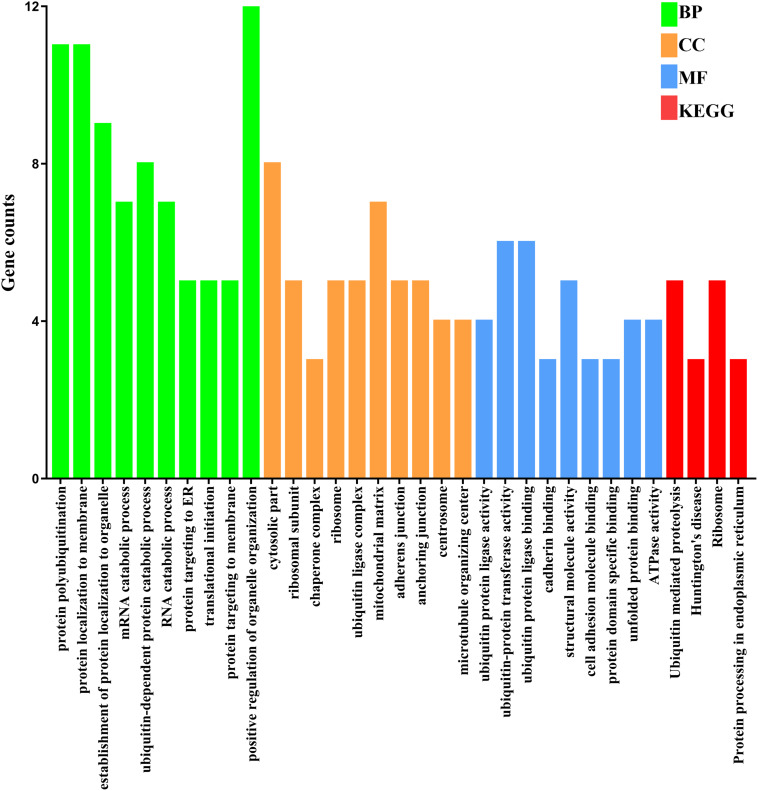
FIGURE 3.
Functional enrichment analyses of the hub genes. The numbers on the x-axis are the names of pathways or GO terms. The numbers on the y-axis are gene counts. BP, biological progress; CC, cellular component; GO, Gene Ontology; KEGG, Kyoto Encyclopedia of Genes and Genomes; MF, molecular function.

