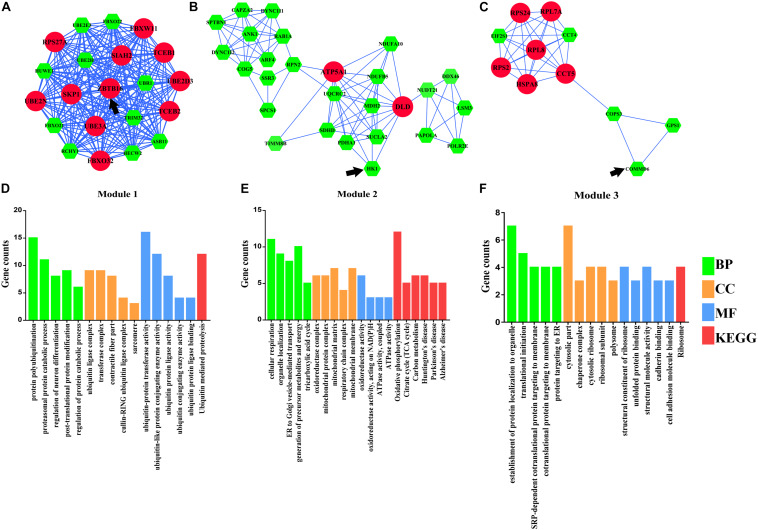
FIGURE 4.
Module analysis of differentially expressed genes (DEmRNAs). (A) Module 1. (B) Module 2. (C) Module 3. (D) Functional enrichment analyses of Module 1. (E) Functional enrichment analyses of Module 2. (F) Functional enrichment analyses of Module 3. Larger circles with red colors represent hub genes, smaller hexagons with green colors represent non-hub genes, and black arrows represent seed genes. BP, biological progress; CC, cellular component; GO, Gene Ontology; KEGG, Kyoto Encyclopedia of Genes and Genomes; MF, molecular function.

