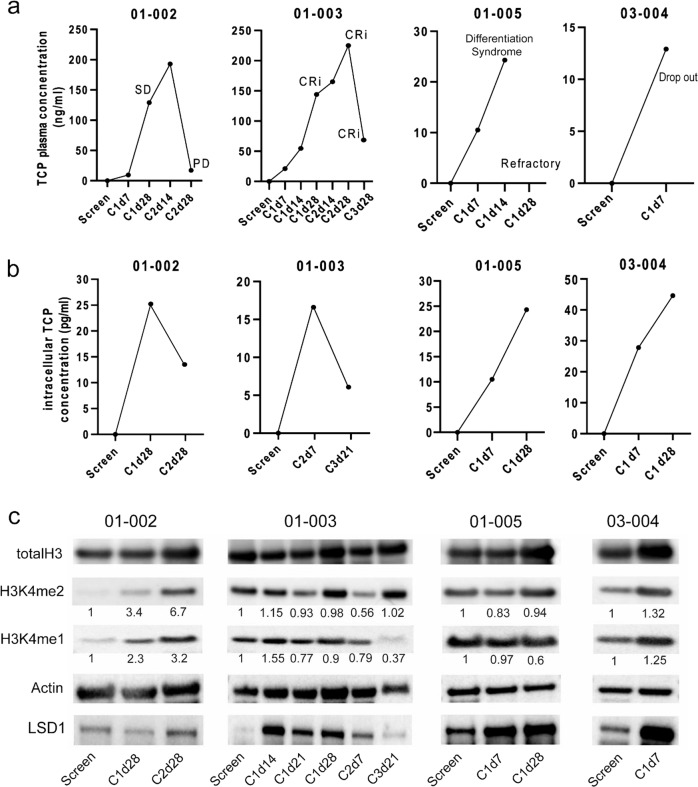
Fig. 6. Tranylcypromine plasma concentrations, intracellular concentrations and H3K4-dimethylation of selected study patients.
a TCP plasma concentrations of indicated study patients at screening and during treatment course. All patients reached the maximum TCP dose of 60 mg/day by day 7. b Intracellular TCP concentrations of indicated study patients at screening and during treatment course. c H3K4me1, H3K4me2, totalH3, LSD1 and Actin protein expression of indicated study patients at screening and during treatment course. H3K4me1/totalH3 and H3K4me2/totalH3 ratios were calculated using ImageJ. Ratios at screening are depicted as a reference value of “1”. Ratios obtained at additional treatment time points are set in proportion accordingly.

