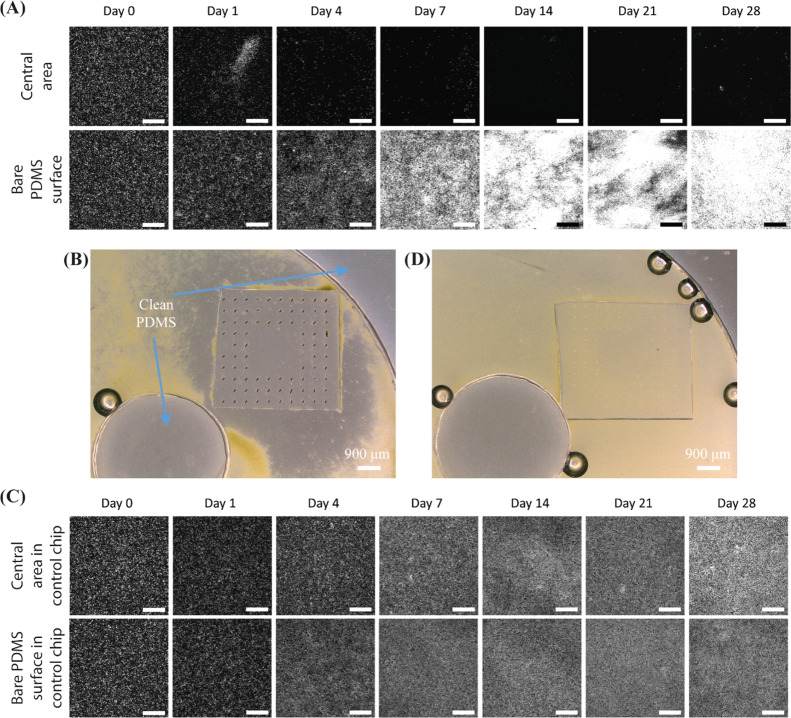
Figure 2.
Microscopy images of antifouling experiments of the partially ciliated surfaces at an actuation frequency of 40 Hz. (A) Fluorescent microscopy images of one recorded representative antifouling experiment from three replicates at the observation areas indicated in Figure 1C, over a period of 28 days. The MAC have a pitch of 450 μm. All scale bars are 300 μm. In the fluorescent images, the bright dots are the algae. Note that only living algae are fluorescent and that the brightness of the algae indicates their viability, which is confirmed by the comparison between the fluorescent and bright-field images. (B) Broader bright-field microscopy image of the ciliated part after 28 days of actuation of one representative experiment from three replicates, showing that the central unciliated area is almost perfectly clean, from a comparison with the clean part of the PDMS chip. In the bright-field images, the green dots are the algae, and the color of clean PDMS is grey. The circle with a black edge and a bright center is an air bubble. (C) Fluorescent microscopy images of one recorded representative control experiment from three replicates at the observation areas indicated in Figure 1C, over a period of 28 days. (D) Broader bright-field microscopy image of a representative control experiment from three replicates after 28 days, showing that the complete channel, including the central area surrounded by non-moving cilia, is fouled indiscriminately.

