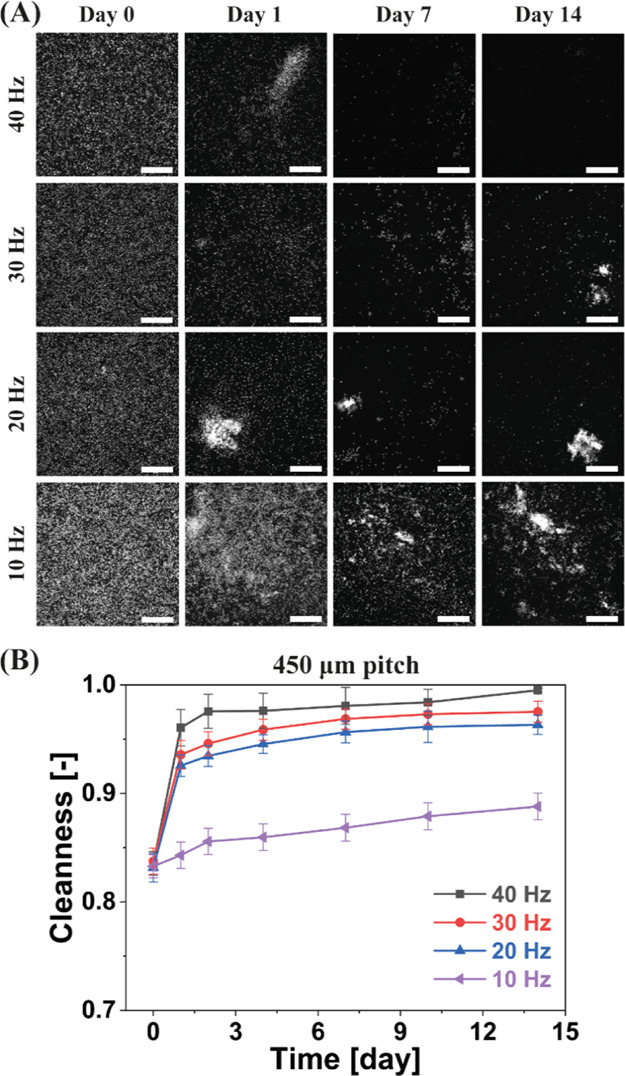
Figure 5.

Impact of the actuation frequency on the antifouling capability of the MAC. (A) Fluorescent microscopy images of one group of recorded representative antifouling experiments from three replicates at the “central” observation area indicated in Figure 1C, over a period of 14 days. The MAC have a pitch of 450 μm. All scale bars are 300 μm. In the fluorescent images, the bright dots are the algae. (B) Calculated antifouling capability over time for partially ciliated surfaces at different actuation frequencies. If the Cleanness equals 1, no algae are present in the observed area. The error bars are the standard deviations of three identical but independent experiments.
