
Figure 5.
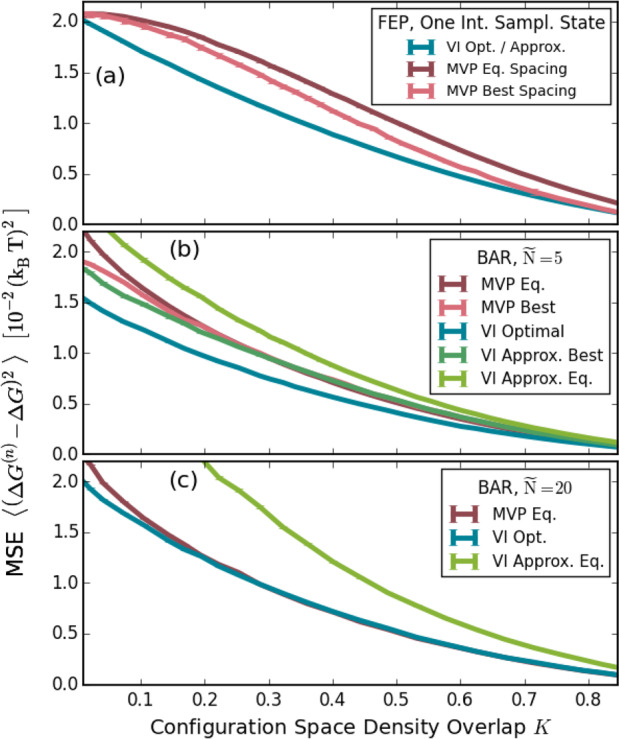
Comparison between the optimal VI, the approximated VI, and the MVP (minimum variance path)26,27 at different numbers of sampling states Ñ. (a) One intermediate sampling state. FEP is used to determine the free-energy difference to the end states. In this case, the optimal VI equals the midpoint of the approximated VI. (b) Five sampling states. BAR is used to calculate the free-energy difference between these 5 states. The overall number of sample points is kept constant, i.e., the number of samples per state is lower for a higher number of states. (c) Using 20 sampling states, otherwise the underlying setup is identical to (b).