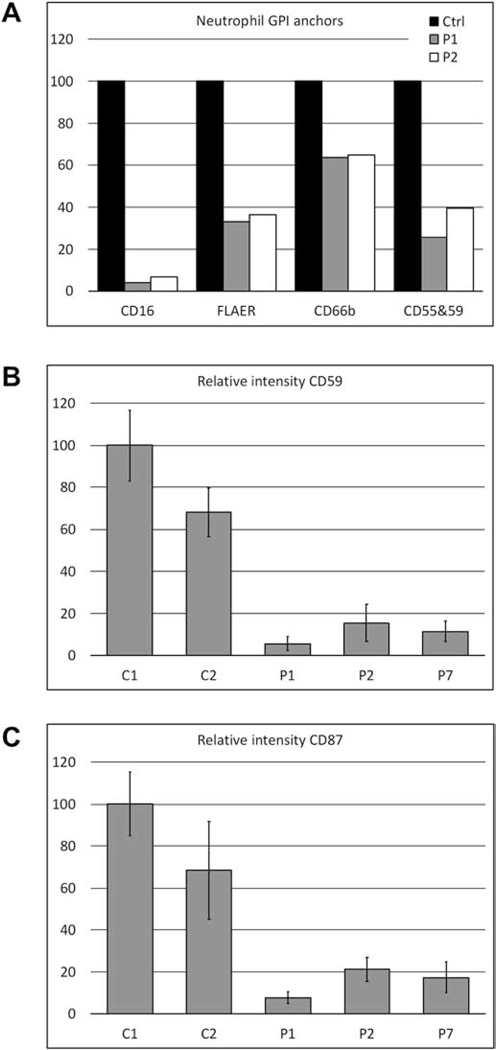
Figure 3. GPI-anchor expression on neutrophils and fibroblasts.
A. FACS analysis of the GPI-anchored proteins CD16, FLAER, CD66b and the combined measurement of CD55 and CD59 on neutrophils reveals a significant reduction in mean fluorescence intensity (MFI) for patients 1 and 2 compared to control. B. MFI of CD59 on patient fibroblasts, measured by immunofluorescence confocal microscopy, was less than 20% of the MFI of the adult control (C1). C2 is a pediatric control that had lower CD59 expression C. MFI of CD87 (uPAR) on patient fibroblasts, measured by immunofluorescence confocal microscopy, was less than 25% of the MFI of an adult control (C1). C2 is a pediatric control that had lower CD87 expression.

