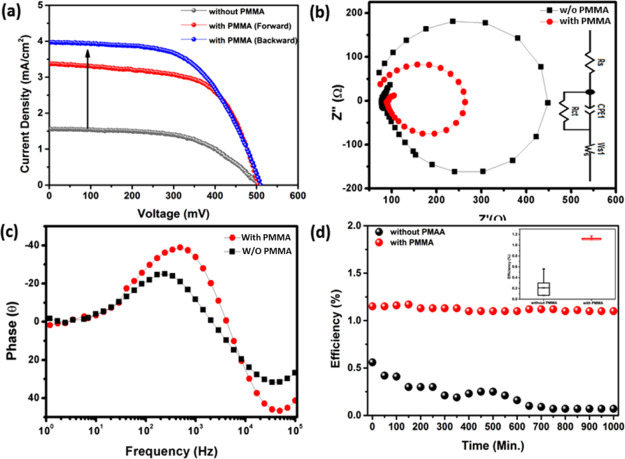
Figure 3.
(a) Current–density vs voltage characteristic plot, (b) EIS spectra along with the fitted circuit diagram in the inset, (c) corresponding Bode plot, and (d) stability measurement plot up to 1000 h along with the corresponding error bar plot in the inset for with and without (w/o) PMMA-encapsulated carbon-based SCs, respectively.

