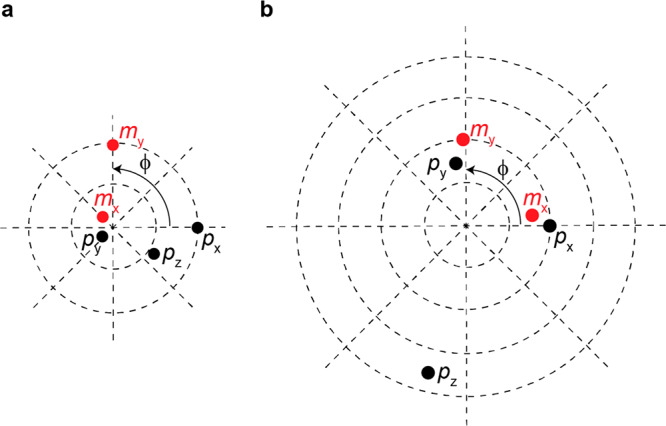
Figure 3.

Multipole decomposition of the scattered field from CL holograpy data. Visualization of numerically retrieved values of electric (black) and magnetic (red) dipole moments. The amplitude of the dipoles is encoded in the radial distance to the center of the circle; the phase in the polar angle ϕ. (a) Electron beam is placed Le = 2.29 μm to the right of a nanohole. (b) Electron beam is placed Le = 2.29 μm to the right of the Ag nanocube.
