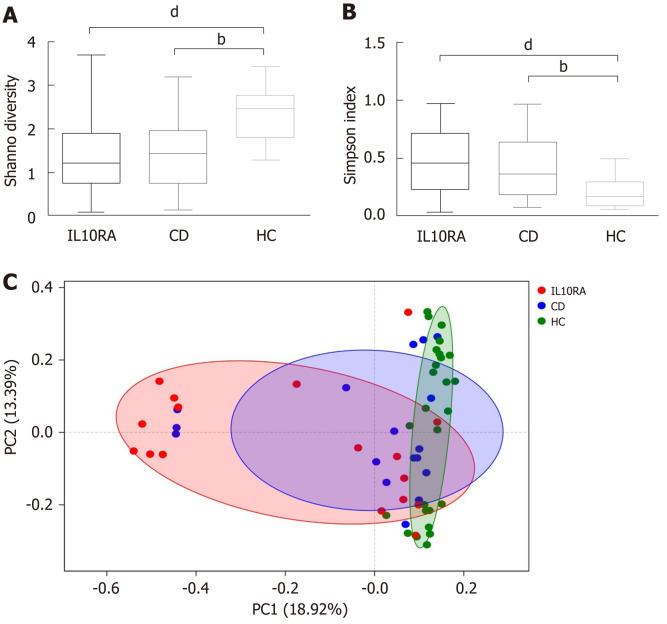
Figure 1.
Diversity of the gut microbiome at the operational taxonomic unit level. A: Box plot of Shannon and Simpson index. For Shannon index, IL10RA vs healthy control (HC) group, P = 0.0007; Crohn's disease (CD) group vs HC, P = 0.0020. For Simpson index, IL10RA vs HC, P = 0.0008; CD vs HC, P = 0.0040. bP < 0.001, dP < 0.0001; B: PCoA using unweighted unifrac distance of operational taxonomic unit community structure. R = 0.2750, P = 0.0011. IL10RA: IL10RA group; CD: Crohn's disease group; HC: Healthy control group.

