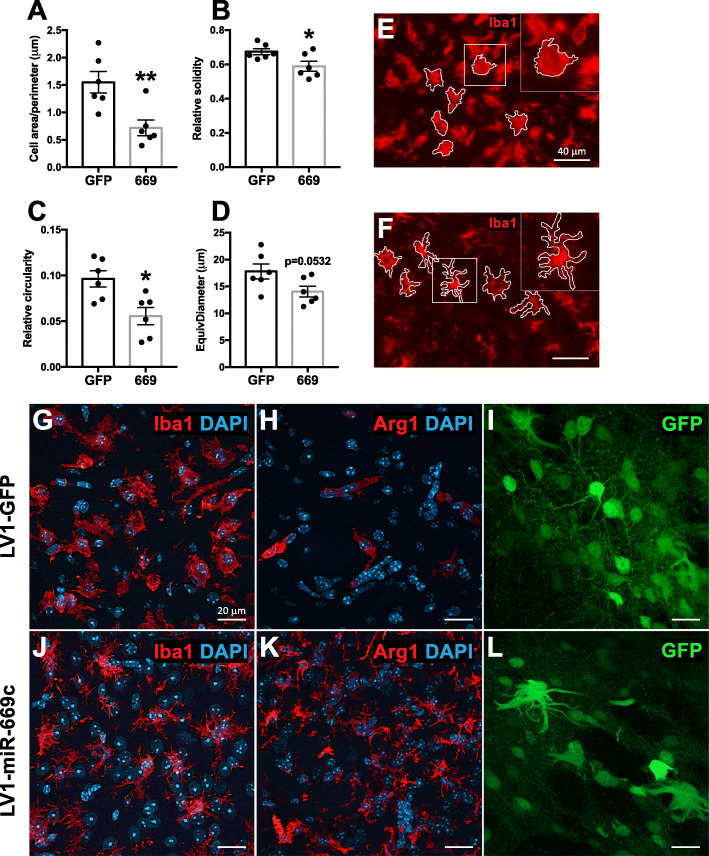
Fig. 7.
MiR-669c overexpression alters microglial morphology under ischemic stroke. Results of the cell morphology characteristic analysis in LV1-GFP (GFP) and LV1-miR-669c (669) animals: area/perimeter ratio (a), solidity (b), circularity (c), and EquivDiameter (d). The representative microphotographs of the infarct area depict the Iba1+ cell morphology in LV1-GFP (e), and LV1-miR-669c (f) overexpressing animals. Unpaired two-tailed t tests: *p < 0.05, **p < 0.01, compared to control group. N = 6 animals per each group. The representative confocal microphotographs taken from ipsilateral striatum illustrate the typical microglial morphology in Iba1 and Arg1 immunostained stroke brain sections of LV1-GFP (g, h) and LV1-miR-669c (j, k) overexpressing mice. Panels i and l represent the GFP overexpressing cells within the striatal area of LV1-GFP (i) and LV1-miR-669c (l) injected stroke animal

