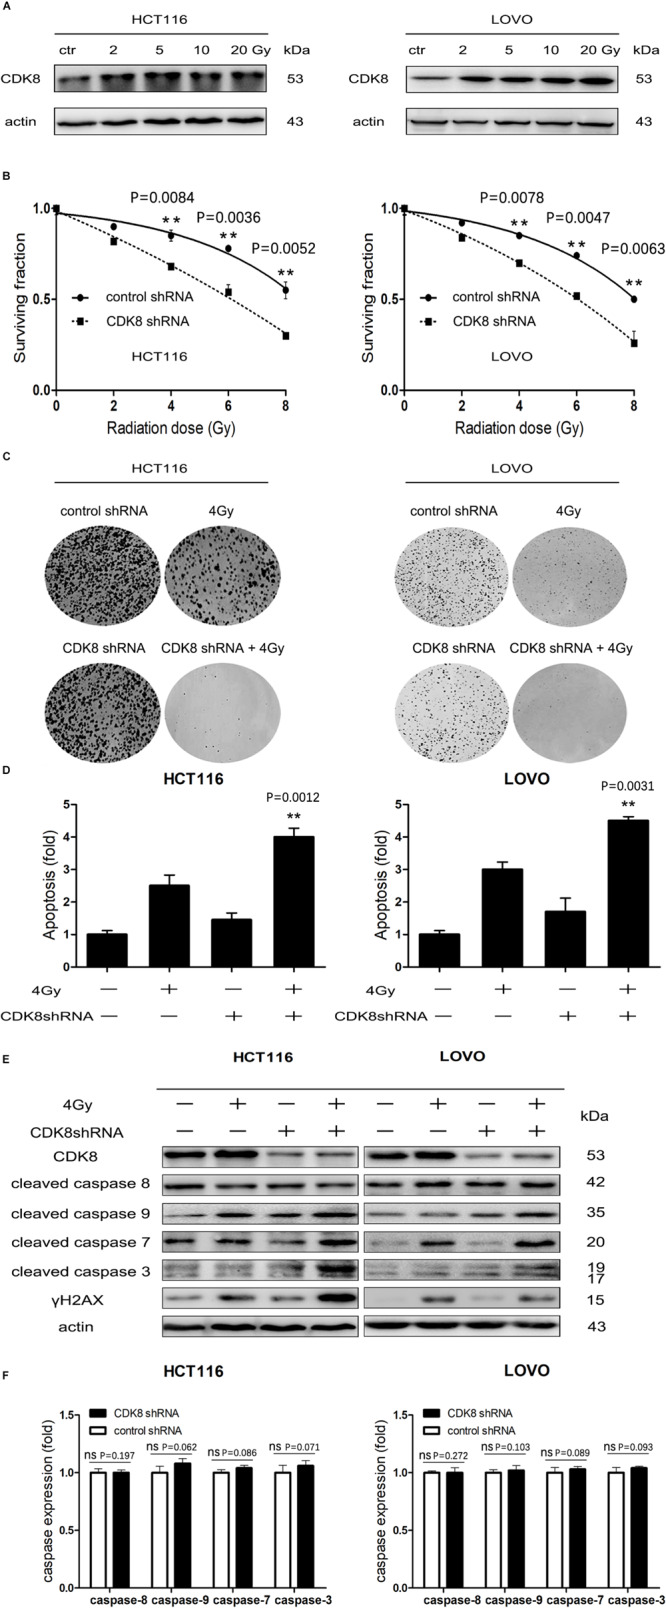
FIGURE 2.

CDK8 Knockdown Increased IR-Induced Intrinsic Apoptotic Signaling in CRC Cells. (A) HCT116 (left) and LOVO cells (right) were irradiated with different doses of radiation and CDK8 protein level was analyzed by western blotting 24 h later. (B) HCT116 (left) and LOVO cells (right) transfected with CDK8 or control shRNA were exposed to different doses of radiation and cell viability was measured 24 h later. (C) Colony formation of HCT116 (left) and LOVO cells (right) transfected with CDK8 or control shRNA was assessed after irradiated with the indicated doses of radiation. (D) The apoptosis levels were assessed using Annexin V-FITC/PI double staining in CDK8 kncokdown HCT116 cells (left) and LOVO cells (right) compared with control shRNA cells at 24 h after 4 Gy irradiation. (E) The expression level of CDK8, γH2AX, cleaved caspase 9, cleaved caspase 8, cleaved caspase 7, and cleaved caspase 3 were detected by western blotting in CDK8 kncokdown HCT116 cells (left) and LOVO cells (right) compared with control shRNA cells at 24 h after 4 Gy irradiation. (F) The intensities of caspase-3,7,8,9 in CDK8 kncokdown HCT116 (left) and LOVO cells (right) were quantified after normalization to β-actin using Image J software. **p < 0.01. Typical results from three independent experiments are shown. The difference between two groups were analyzed with the Student’s t test. One-way analysis of variance (ANOVA) followed by Post hoc test was used in multiple groups.
