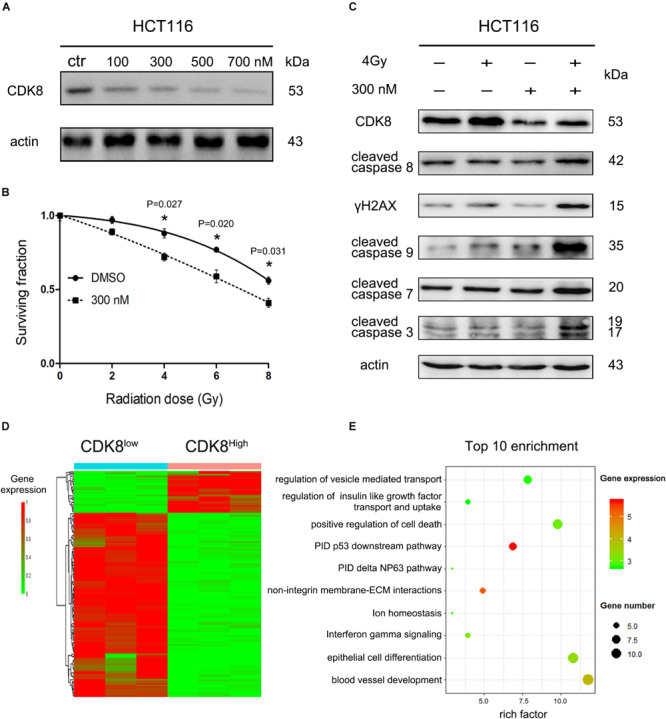
FIGURE 6.

Clinical Drug Ponatinib Increased Radiosensitivity of CRC Cells. (A) HCT116 cells were treated with different doses of ponatinib and the protein level of CDK8 was analyzed by western blotting 24 h later. (B) HCT116 cells were pre-treated with 300 nM ponatinib for 24 h prior to irradiation with different doses of radiation, and cell viability was measured after 24 h. (C) HCT116 cells were pre-treated with 300 nM ponatinib for 24 h before 4 Gy irradiation, and the expression level of CDK8, γH2AX, cleaved caspase 9, cleaved caspase 8, cleaved caspase 7, and cleaved caspase 3 were assessed by western blotting after 24 h. (D) Heatmap shows the 122 differentially expressed genes (DEGs) in CDK8Low versus CDK8High. Among the 122 genes, 28 were downregulated and 94 were upregulated. (E) A bubble plot displays the 10 most significant terms identified by Metascape analysis. Bubble colors represent the corrected P values. *p < 0.05. Typical results from three independent experiments are shown. The difference between two groups were analyzed with the Student’s t test. One-way analysis of variance (ANOVA) followed by Post hoc test was used in multiple groups.
