Fig. 7.
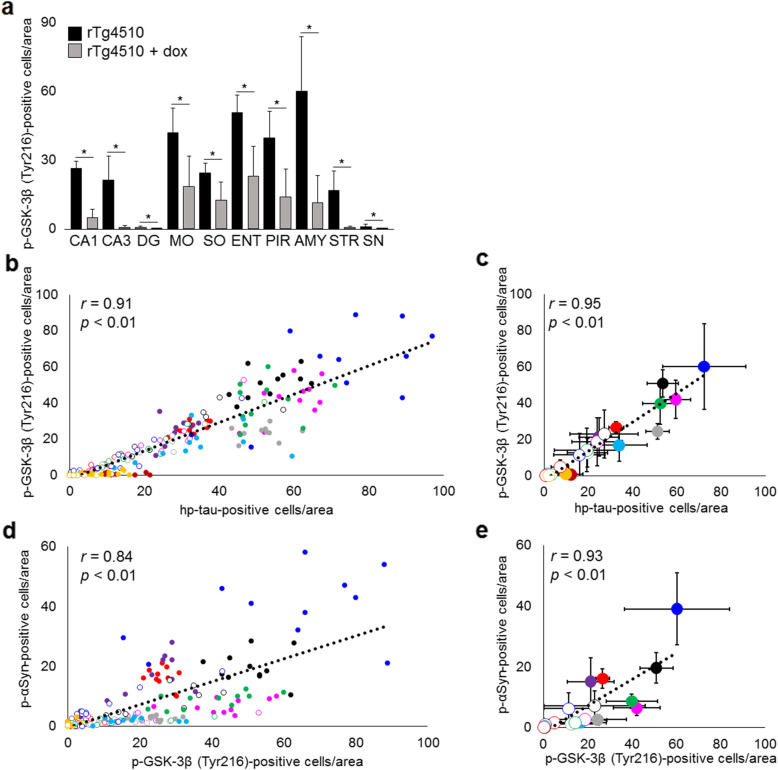
Semi-quantitative analysis of p-GSK-3β (Tyr216) in 10 regions: hippocampal CA1 and CA3 areas, dentate gyrus (DG), motor area (MO), somatosensory area (SO), entorhinal cortex (ENT), piriform cortex (PIR), amygdala (AMY), striatum (STR), and substantia nigra (SN), in rTg4510 mice fed the standard (n = 11) or doxycycline (dox) diet (n = 10). The accumulation of p-GSK-3β (Tyr216) was decreased in all regions studied in rTg4510 mice fed the dox diet (*p < 0.01, a). Positive correlations were observed between the number of hp-tau-positive cells and p-GSK-3β (Tyr216)-positive cells (r = 0.91, p < 0.01, b) and between the average number of hp-tau-positive cells and p-GSK-3β (Tyr216)-positive cells in each region (r = 0.95, p < 0.01, c). Moreover, positive correlations were found between the number of p-αSyn-positive cells and p-GSK-3β (Tyr216)-positive cells (r = 0.84, p < 0.01, d) and between the average number of p-αSyn-positive cells and p-GSK-3β (Tyr216)-positive cells in each region (r = 0.93, p < 0.01, e). Colors: red, CA1; purple, CA3; deep red, DG; pink, MO; gray; SO; black, ENT; green; PIR; blue, AMY; light blue, STR; orange, SN. Diagrams: circular dot, rTg4510 mice fed the control diet; circle, rTg4510 mice fed the dox diet

