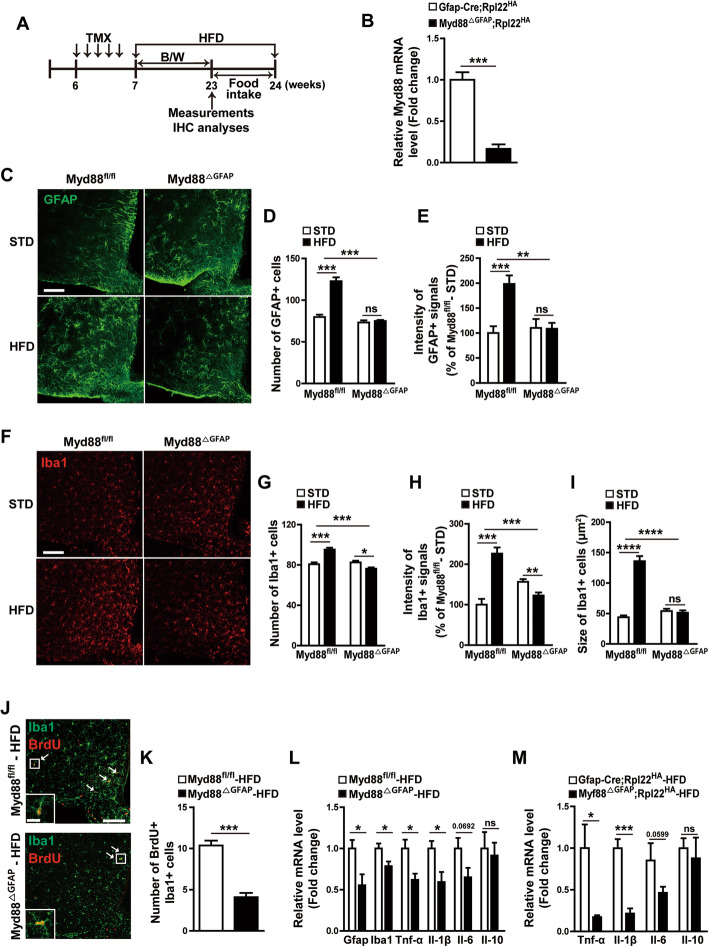
Fig. 2.
HFD-induced hypothalamic reactive gliosis is reduced by astrocyte-specific Myd88 KO. a Diagram depicts the experimental design. TMX, tamoxifen. B/W, body weight. IHC, immunohistochemistry. b The expression of Myd88 mRNA was determined using a real-time PCR analysis with RNA samples immunoprecipitated with HA antibody from hypothalamic extracts of Myd88△GFAP;Rpl22HA mice that were generated by cross-breeding astrocyte-specific Myd88 KO mice (Myd88△GFAP) with transgenic mice (Rpl22HA) expressing HA-tagged Rpl22. Gfap-Cre;Rpl22HA mice were used as the control (n = 4–5/group). c–i Control (Myd88fl/fl) mice and Myd88△GFAP mice were fed a STD or HFD for 16 weeks, and their astrocytes and microglia in the hypothalamic ARC were analyzed with immunohistochemistry using GFAP and Iba1 antibodies. Representative images (c, f) and calculated data (d, e, g, h, i) show the effect of astrocyte-specific Myd88 KO (Myd88△GFAP) on the HFD-induced increase in the number and intensity of GFAP-positive cells (c–e) and Iba1-positive cells (f–h), and the size of Iba1-positive cells (i) in the ARC compared with the control Myd88fl/fl mice (n=3–6 sections of 3–6 mice/group). j, k Representative images (j) and calculated data (k) indicate HFD-induced BrdU and Iba1 double-positive cells in the ARC of Myd88△GFAP mice and control Myd88fl/fl mice after HFD feeding for 8 weeks. White arrows indicate cells double positive for Iba1 and BrdU (n = 6 sections of 3 mice/group). l Real-time PCR analysis of RNA samples shows the expression of Gfap, Iba1, Tnf-α, Il-1β, Il-6, and Il-10 in the hypothalamus of Myd88△GFAP mice and control Myd88fl/fl mice after HFD feeding for 16 weeks (n = 3/group). m Hypothalamic expression of Tnf-α, Il-1β, Il-6, and Il-10 was determined using a real-time PCR analysis of RNA samples (immunoprecipitated with HA antibody) from hypothalamic extracts of Myd88△GFAP;Rpl22HA mice and control Gfap-Cre;Rpl22HA mice after HFD feeding for 16 weeks (n = 3–4/group). Data are presented as mean ± SEM. *p < 0.05, **p < 0.01, ***p < 0.001, and ****p < 0.0001. ns, not significant. Scale bar = 100 μm (20 μm for higher magnification view in insets)

