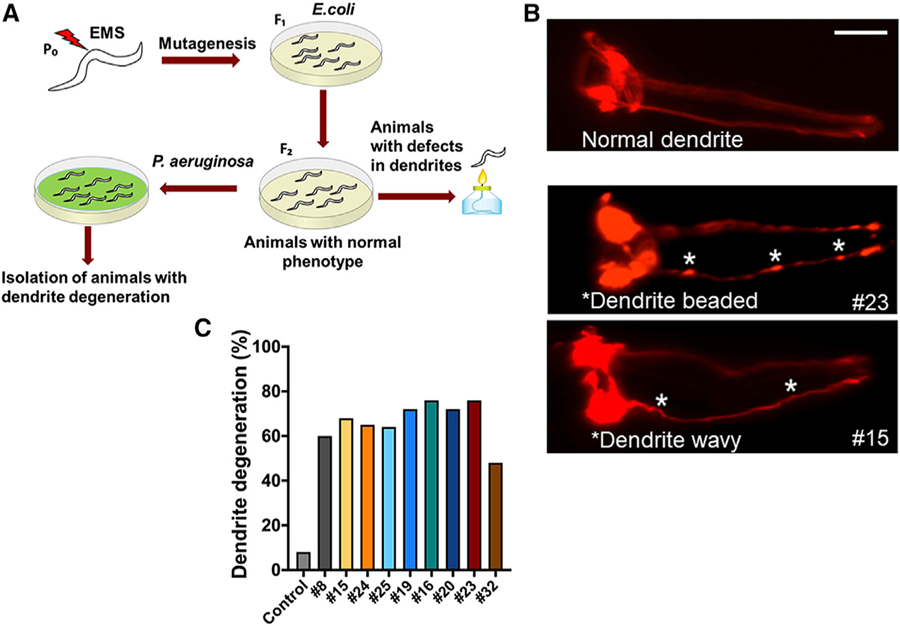
Figure 1. Forward Genetic Screen to Isolate Mutants Susceptible to Infection-Associated Dendrite Degeneration.
(A) Schematic diagram of the forward genetic screen. Animals (P0) were treated with ethylmethanesulfonate (EMS) and the F1 animals were self-fertilized. The F2 animals were analyzed for dendrite degeneration, and animals exhibiting any changes were discarded. The remaining mutants were infected with P. aeruginosa for 24 h and screened for dendrite degeneration.
(B) Representative photomicrographs of dendrite degeneration in control animals expressing RFP under the control of odr-1 promoter (CX5974) (top panel) and two representative mutants (#23 and #15) (bottom panels) after exposed to P. aeruginosa for 24 h. The scale bars represent 20 µm. White asterisk indicates bead-like structures and wavy dendrites.
(C) Quantification of dendrite degeneration in control and different mutant animals after 24 h of infection.

