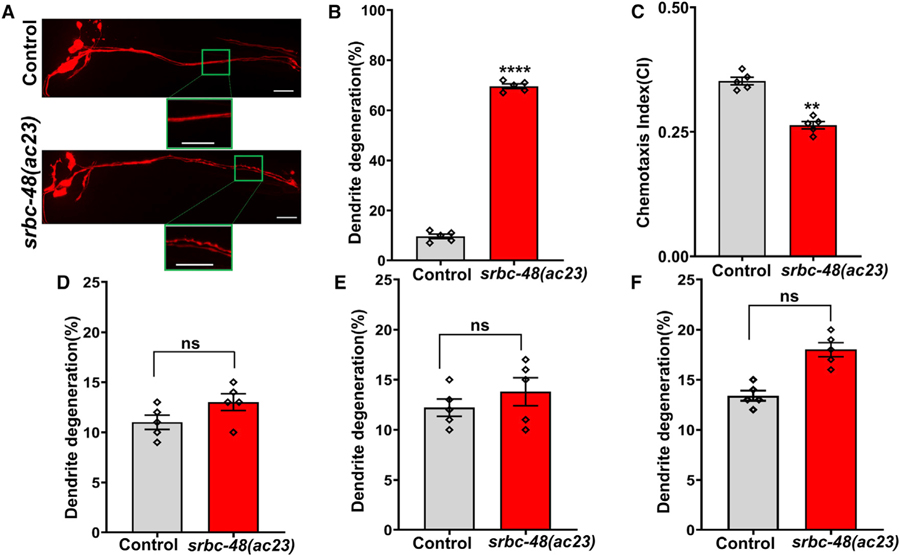
Figure 2. srbc-48(ac23) Animals Are Susceptible to Infection-Associated Dendrite Degeneration.
(A) Representative photomicrographs of dendrite degeneration in control (CX5974) and srbc-48(ac23) animals after exposure to P. aeruginosa for 24 h. The scale bars represent 20 µm.
(B) Quantification of dendrite degeneration in control and srbc-48(ac23) animals. Control versus srbc-48(ac23) (p < 0.0001) via t test (n = 5; animals per condition = 50).
(C) Quantification of chemotaxis index (CI) in control and srbc-48(ac23) animals in response to benzaldehyde. Control versus srbc-48(ac23) (p < 0.01) via t test (n = 5; animals per condition > 100).
(D) Quantification of dendrite degeneration in control and srbc-48(ac23) animals after exposure to E. faecalis for 24 h. Control versus srbc-48(ac23) (n.s.) via t test (n = 5; animals per condition = 20).
(E) Quantification of dendrite degeneration in control and srbc-48(ac23) animals in response to cold stress. Control versus srbc-48(ac23) (n.s.) via t test (n = 5; animals per condition = 20).
(F) Quantification of dendrite degeneration in control and srbc-48(ac23) animals in response to osmotic stress. Control versus srbc-48(ac23) (n.s.) (n = 5; animals per condition = 20) via t test.
(B–F) The rhomboids represent individual experiments.

