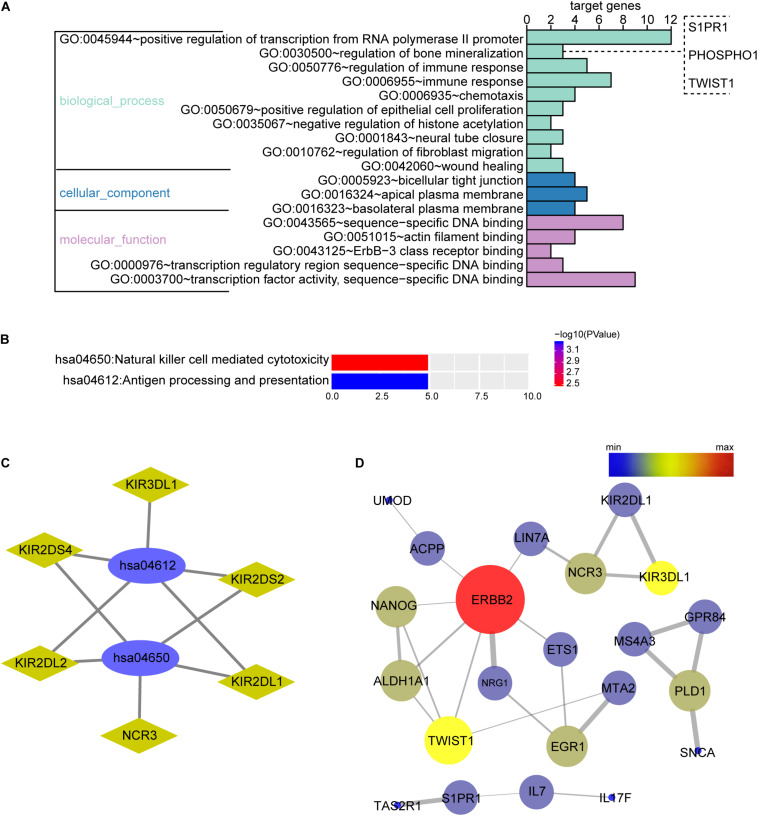
FIGURE 2.
Biological function enrichment analysis of the OMRGs. (A) Bar chart of gene ontology (GO) analysis. Genes associated with biological process, cellular component, and molecular function were analyzed for OMRGs. The horizontal axis shows the number of the target genes, and the vertical axis represents GO ID and annotation. (B) Bar chart of the KEGG analysis for OMRGs. The horizontal axis shows the number of the target genes, the right vertical axis -log10 (P value), and the left vertical axis KEGG pathway ID and annotation. (C) Plots show the relationship between the OMRGs and the KEGG pathways. The ellipse plots show the KEGG pathway ID, the rhombus plots the target gene, and the green plots down-regulated genes. (D) PPI network analysis of the OMRGs. The nodes represent the OMRGs in the PPI network, and the lines show the interaction among the OMRGs. The size and color of nodes are associated with the significance degree of proteins, while the thickness of lines is proportional to the strength of interactions among proteins.

