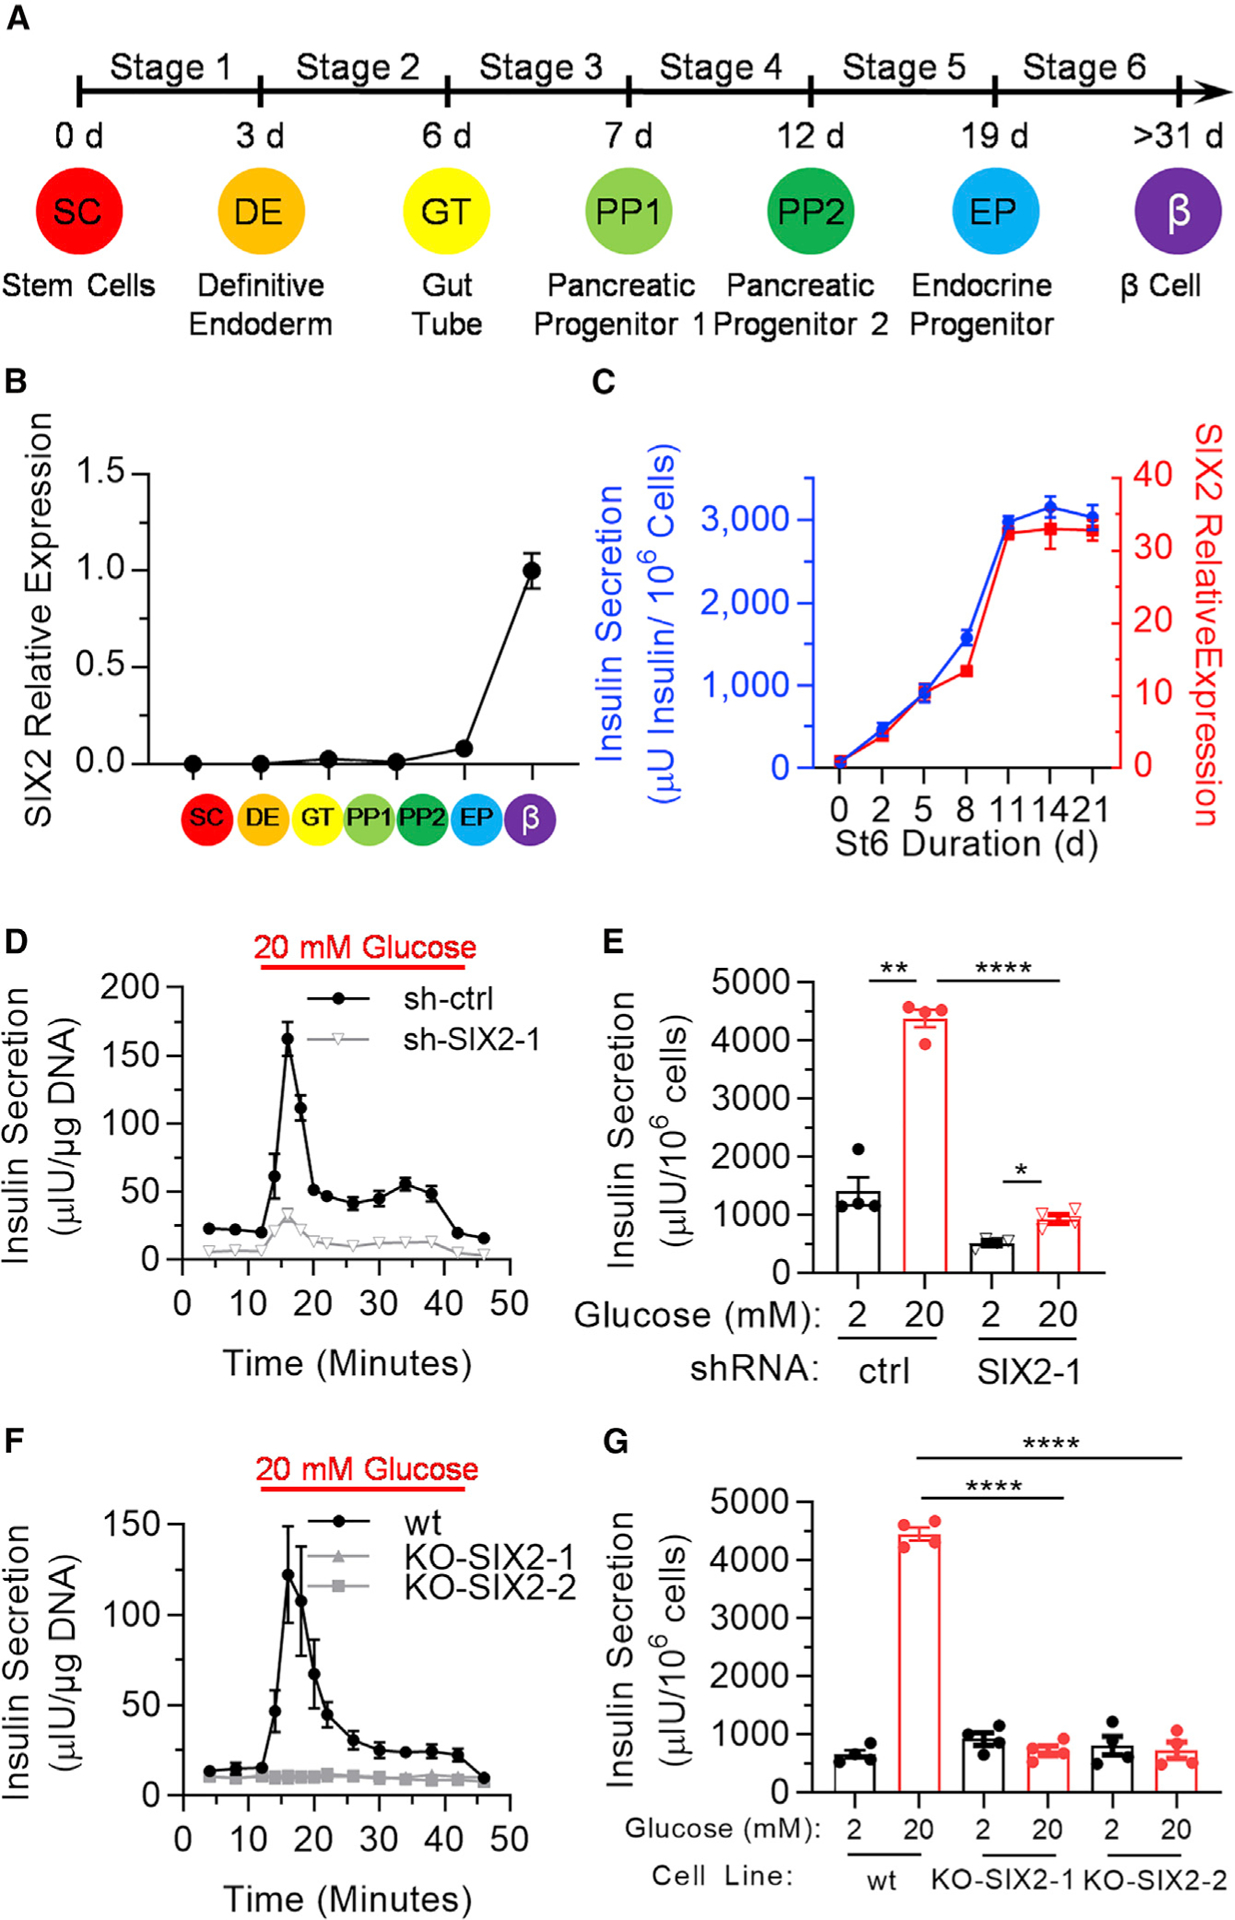
Figure 1. SIX2 Controls Glucose-Stimulated Insulin Secretion in Human SC-β Cells.

(A) Schematic of hESC differentiation process.
(B) Real-time PCR measurements of SIX2 in undifferentiated hESCs and at the end of each stage of the differentiation. Data are presented as the fold change relative to stage 6 cells. n = 3.
(C) Real-time PCR measurements of SIX2 as a function of time in stage 6 plotted against insulin secretion of sampled cells placed in 20 mM glucose for 1 h. n = 4.
(D) Dynamic glucose-stimulated insulin secretion of stage 6 cells transfected with control shRNA (shctrl; n = 3) or shRNA targeting SIX2 (sh-SIX2–1; n =4). Cells are perfused with 2 mM glucose, except when indicated, in a perifusion chamber.
(E) Static glucose-stimulated insulin secretion of sh-ctrl or sh-SIX2–1 transduced stage 6 cells. n = 4.
(F) Dynamic glucose-stimulated insulin secretion of wild-type (WT) (n = 4), KO-SIX2–1 (n = 3 technical replicates), or KO-SIX2–2 (n = 3 technical replicates) stage 6 cells.
(G) Static glucose-stimulated insulin secretion of WT, KO-SIX2–1, or KO-SIX2–2 stage 6 cells. n = 4. All data in (B)–(E) were generated with cells from protocol 1 and all data in (F) and (G) were generated with cells from protocol 2.
*p < 0.05, **p < 0.01, ****p < 0.0001 by 2-way paired (for low-high glucose comparison) or unpaired (for high-high glucose comparison) t test. Error bars represent s.e.m. See also Figure S1.
