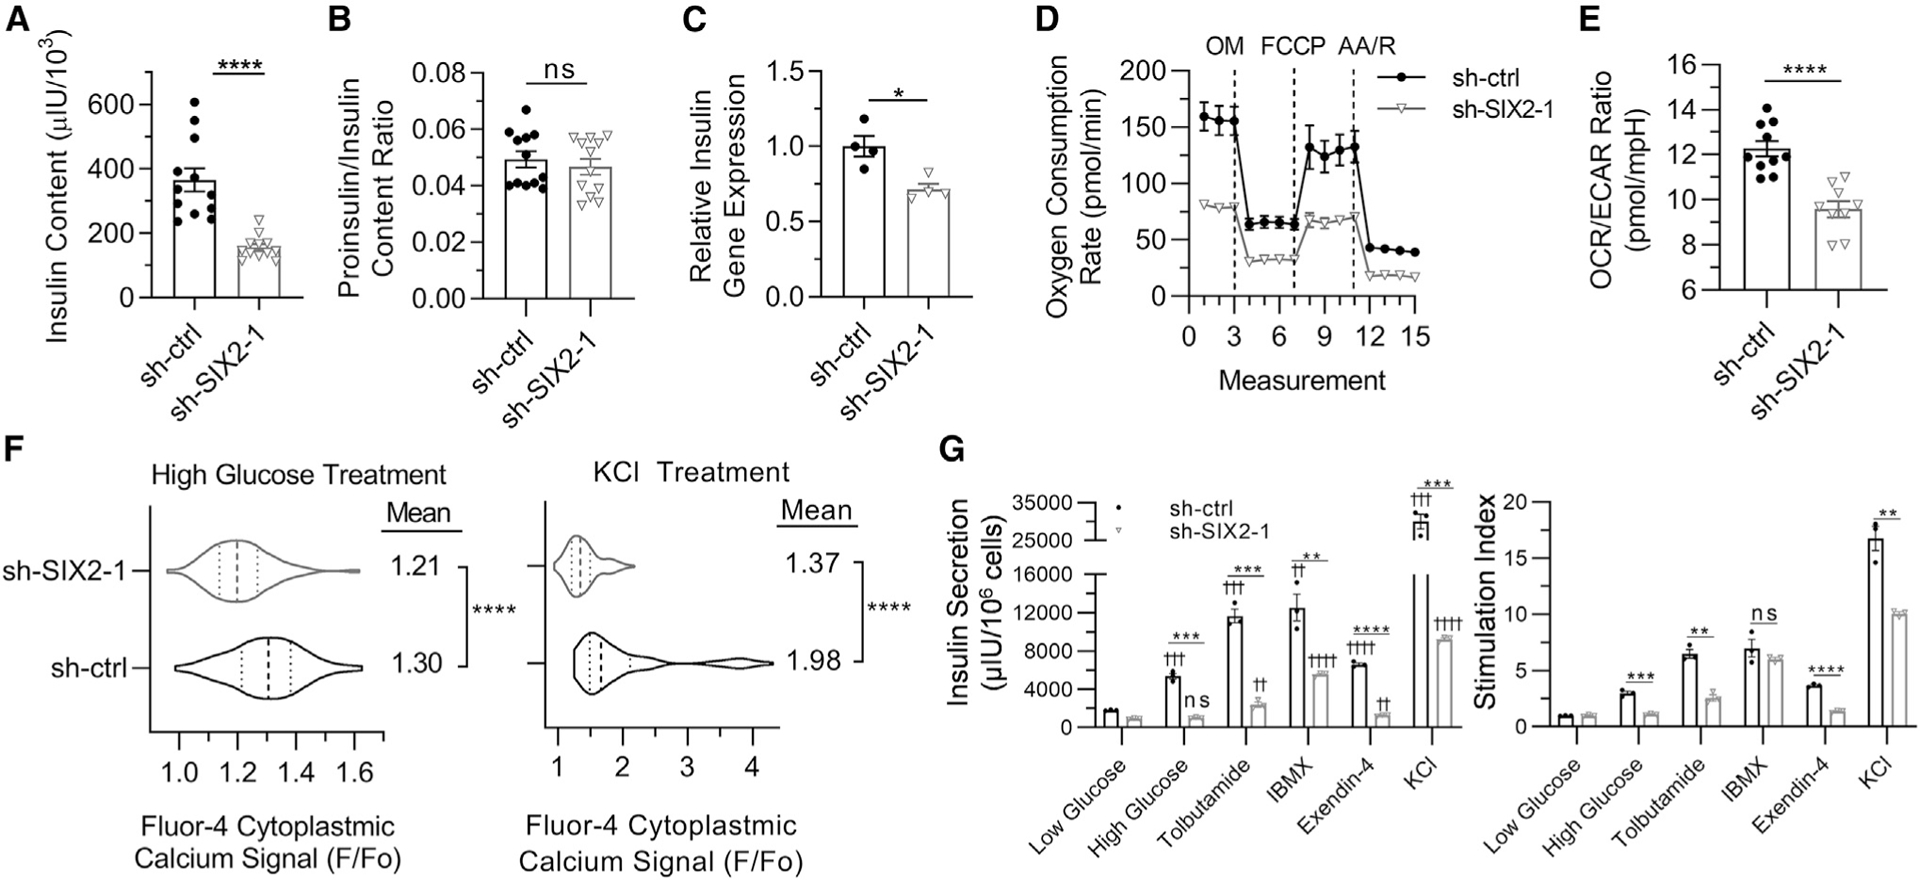
Figure 4. SIX2 Affects Insulin Content, Mitochondrial Respiration, Cytoplasmic Calcium Flux, and Response to Secretagogues in SC-β cells.

(A) Insulin content for stage 6 cells. n = 12. ****p < 0.0001 by 2-way unpaired t test.
(B) Proinsulin:insulin content ratio for stage 6 cells. n = 12. ns (non-significant) by 2-way unpaired t test.
(C) Real-time PCR measurements of INS gene expression for stage 6 cells. n = 4. *p < 0.05 by 2-way unpaired t test.
(D) OCR measurements under basal conditions and after sequential injections of oligomycin (OM), carbonyl cyanide-4-(trifluoromethoxy)phenylhydrazone (FCCP), and antimycin A with rotenone (AA/R). n = 10 for sh-ctrl and n = 9 for sh-SIX2–1.
(E) Calculated OCR:ECAR ratio under basal conditions. n = 10 for sh-ctrl and n = 9 for sh-SIX2–1. ****p < 0.0001 by 2-way unpaired t test.
(F) Cytosolic calcium signaling in response to high glucose (20 mM) and high KCl (30 mM) treatment relative to low glucose (2 mM, Fo) for Fluo-4 AM. Violin plots show distribution of cellular responses for sh-ctrl (n = 232) and sh-SIX2–1 (n = 276) transduced cells with median and quartiles marked with dashed lines. ****p <0.0001 by 2-way unpaired t test.
(G) Static glucose-stimulated insulin secretion with cells with 2 mM glucose, 20 mM glucose, or 20 mM glucose with the indicated compound. n = 3. ns, ** or ††p < 0.01, *** or †††p < 0.001, **** or ††††p < 0.0001 by 2-way unpaired t test. * indicates comparison within same compound treatment. † indicates comparison with low glucose with same shRNA treatment.
Error bars represent s.e.m.
See also Figure S4.
