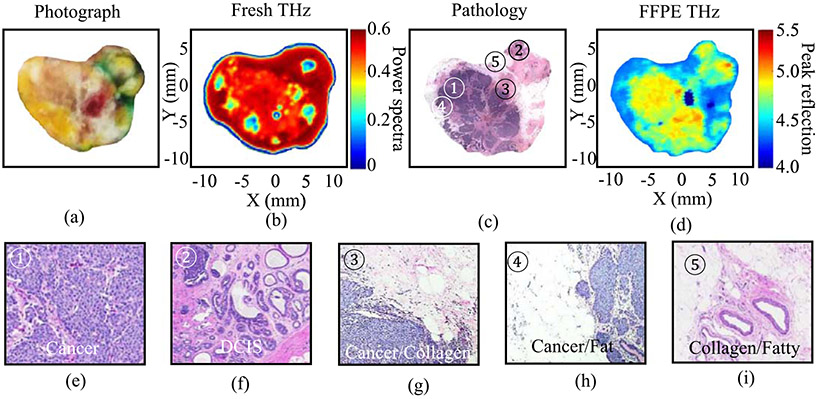
Fig. 4.
THz images of human breast cancer tissue. (a) The photograph of fresh tissue. (b) The frequency domain THz image of fresh tissue represented in spectral power. (c) The low power pathology image. (d) The time domain THz image of FFPE block tissue. (e) The high power pathology image of cancer region marked as ① in (c), (f). The high power pathology image of DCIS region marked as ② in (c), (g). The high power pathology image of cancer-collagen region marked as ③ in (c), (h). The high power pathology image of cancer-fat region marked as ④ in (c), (i). The high power pathology image of collagen-fatty region marked as ⑤ in (c).

