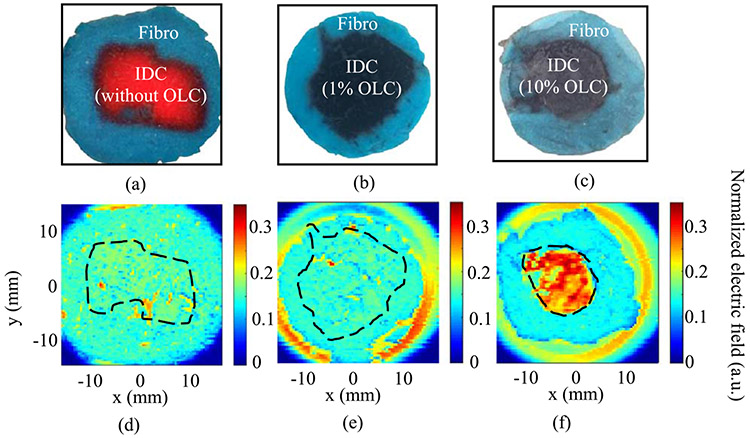
Fig. 7.
THz reflection imaging of combined phantoms shown in photographs for (a) photo of IDC phantom with no onion-like carbon (OLC), (b) photo of IDC phantom with 1% of 100 nm OLC, and (c) photo of IDC phantom with 10% of 100 nm OLC. THz images in (d)–(f) show the resulting THz reflection images for (d) no OLC in IDC, (e) 1% OLC in IDC, and (f) 10% OLC in IDC [5].

