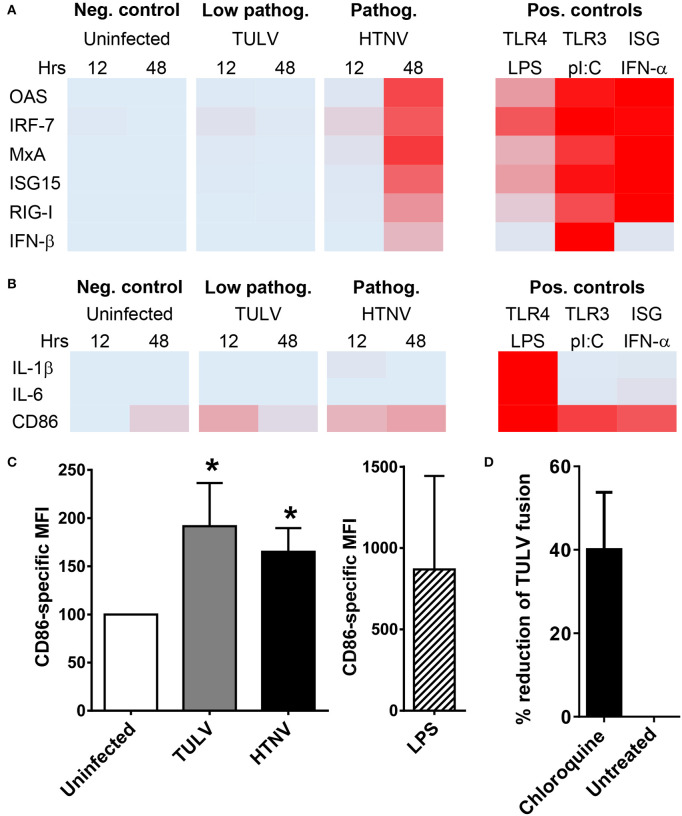
Figure 3.
Post-entry block of TULV replication in myeloid cells. (A) iDCs were left uninfected or infected with either HTNV or TULV (MOI of 1.5) for 12 or 48 h. As positive controls cells were treated with LPS (1 μg/ml), poly I:C (1 μg/ml), or IFN-α 2a (5,000 U/ml) for 8 h. Heat map of RT-qPCR analysis of (A) ISGs (OAS, IRF-7, MxA, ISG15, RIG-I, and IFN-β) and of (B) NF-kB driven genes (IL-1β, IL-6, CD86). The RT-qPCR analyses corresponding to the heat maps are shown in Figures S4, S5. Mean values from three different donors were normalized to the maximum positive control value for each gene giving values from 0 (no expression; light blue) to 1 (maximum expression; red). (C) Flow cytometric analysis of CD86 expression on iDCs infected for 12 h. The data are shown as CD86-specific MFI. LPS-stimulated iDCs served as a maximum control. Error bars represent the mean ± SD. The data are derived from iDCs from three different donors (*p < 0.05, Students t-test). (D) HEL cells were pretreated with 2 mM chloroquine or left untreated before being incubated with TULV (MOI of 5) for 2 h at 37°C. Cells were washed thoroughly with PBS with 50 μg/ml heparin before being harvested and analyzed by RT-qPCR for TULV genome. The reduction in viral genome numbers relative to untreated cells is shown, error bar represents mean ± SEM of four independent experiments.

