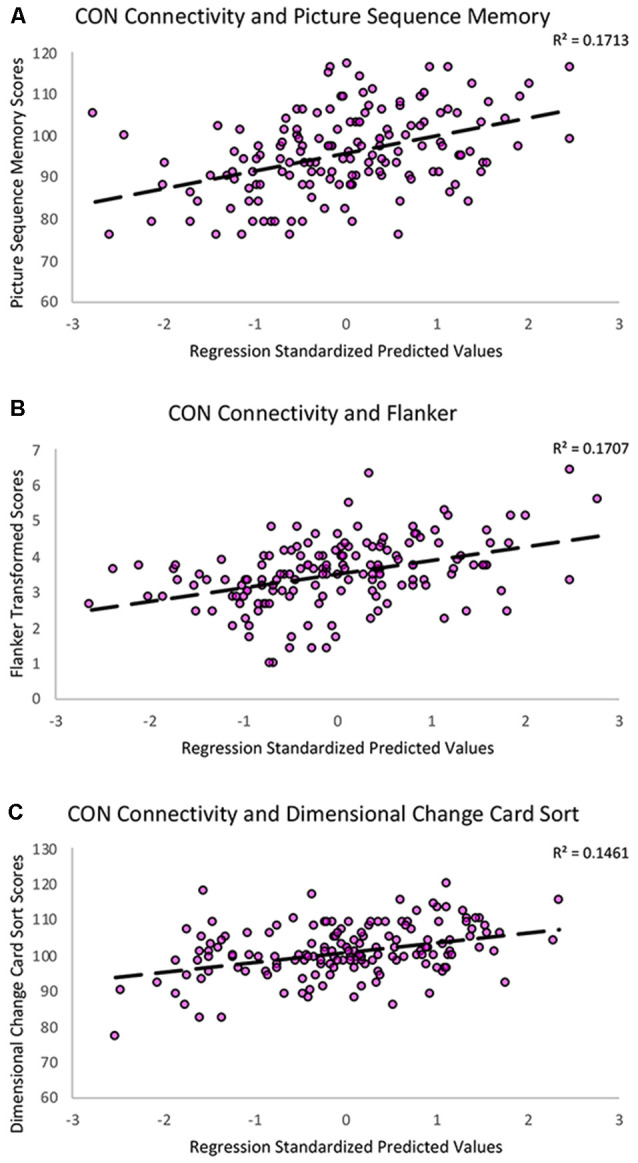
Figure 4.

Scatterplots showing the significant relationships between (A) Picture Sequence Memory (B) Flanker and (C) Dimensional Change Card Sort subtest scores and CON within-network resting-state connectivity controlling for age, education, sex, and scanner covariates. The Y-axes reflect the unadjusted standard scores for Picture Sequence Memory and Dimensional Change Card Sort and the square root transformed scores for the Flanker task.
