
Figure 2.
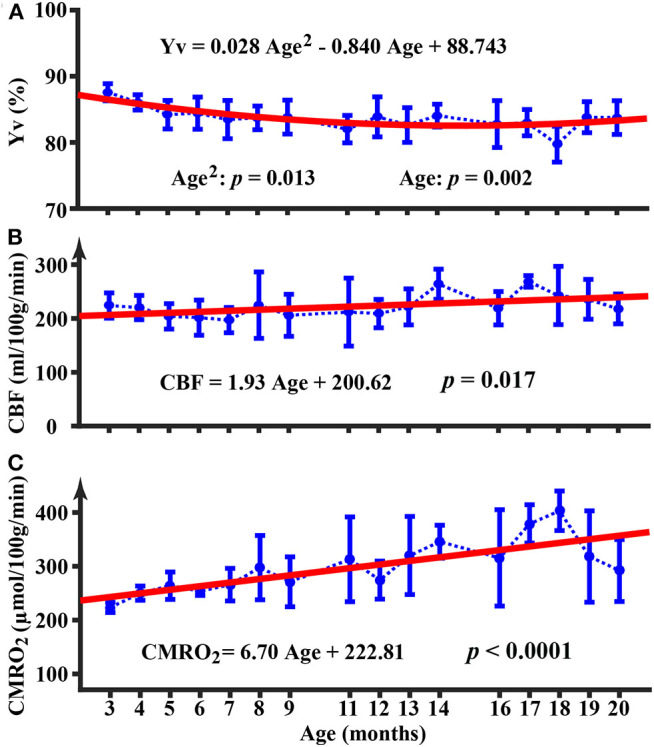
Longitudinal time courses of physiological parameters of Yv (A), CBF (B), and CMRO2 (C). Error bar denotes the standard deviation across mice (N = 5). Red line indicates the fitting curve from a mixed-effect model. Equation shows the fixed term estimated from the mixed-effect model.